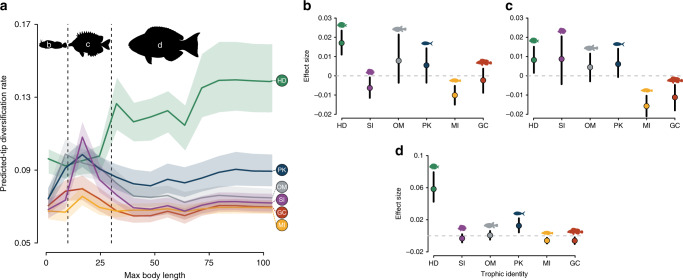
Fig. 3. Tip diversification rates predicted for reef fish trophic groups while varying body size.
a Predicted tip diversification rates for species of various maximum body lengths in different trophic groups, based on an extreme gradient boosting model (n = 1000 model bootstraps). All other variables are kept at their mean values and categorical variables (except trophic identity) in the most common category. Solid lines show median predictions per trophic group with respective prediction quantile intervals (25% and 75%). Dashed line separates size classes for which we show effect sizes per trophic group: b below 10 cm; c between 10 and 30 cm; d above 30 cm. In b–d, circles show the median effects (trophic group median minus global median in each size class) and black lines show 25% and 75% effect quantiles. HD: herbivores/detritivores (green); SI: sessile invertivores (purple); OM: omnivores (gray); PK: planktivores (blue); MI: mobile invertivores (yellow); GC: generalized carnivores (red). Fish silhouettes were sourced from Schiettekatte et al.91. Source data are provided as a Source Data file.

