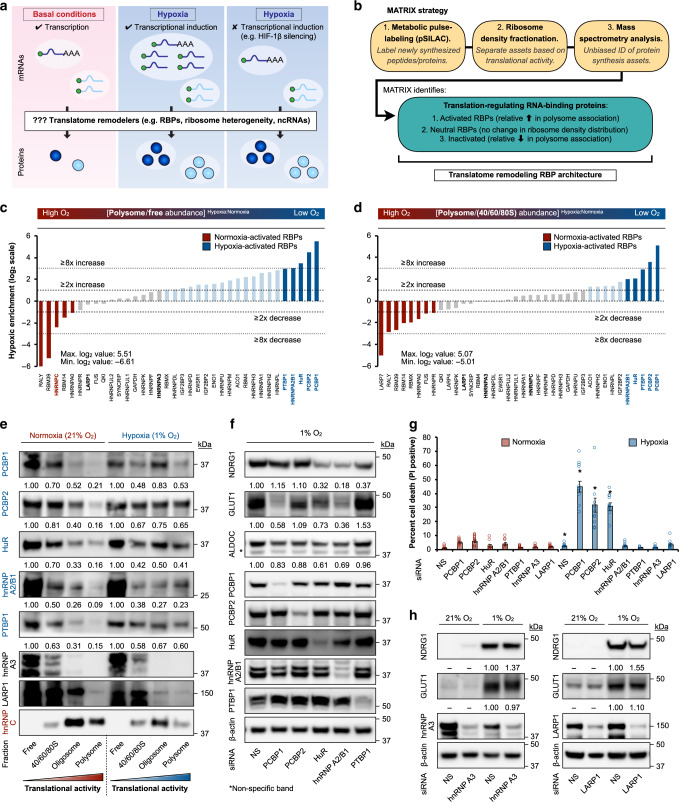
Fig. 1. Oxygen-sensitive rewiring of RBP engagement in protein synthesis.
a Model of hypoxia-induced translatome remodeling, highlighting the concept that translational reprogramming resulting in increased protein synthesis can occur independently of mRNA-level adaptations. Color scheme: red, normoxia; blue, hypoxia. b Schematic of MATRIX platform. Asset refers to proteins involved in translation, e.g., translation factors, ribosomal proteins, RBPs, etc. c Primary MATRIX readout of relative RBP translational engagement (ratio of polysome/free protein abundance) in hypoxic (1% O2, 24 h, blue) versus normoxic (21% O2, 24 h, red) U87MG. d Secondary MATRIX readout of relative RBP translational engagement (ratio of polysome/monosome protein abundance). Validated RBPs (e) are bolded. e Representative immunoblots of indicated RBPs in normoxic and hypoxic U87MG ribosome density fractions. RBPs whose translational activity is activated and repressed by hypoxia are highlighted in blue and red, respectively. Quantitation represents mean of three independent experiments (n = 3). f Representative immunoblots of U87MG treated with siRNAs (for 48 h prior to following experimentation) against hypoxia-adaptive RBPs. NS: non-silencing. Quantitation represents mean of four independent experiments (n = 4). g Cell death measurements by propidium iodide (PI) staining in U87MG treated with indicated siRNAs. Asterisk denotes statistical significance calculated using two-sided Student’s t-tests compared to corresponding normoxic measurements. Exact p values: NS siRNA (p = 0.005), PCBP1 siRNA (p = 2.11e−06), HuR siRNA (p = 0.0006), and hnRNP A2/B1 siRNA (p = 2.08e−07). Data represent mean ± SEM (error bars) (n = 10 fields over three independent experiments). h Representative immunoblots of U87MG treated with siRNAs against non-hypoxia-activated RBPs. NS: non-silencing. Quantitation represents mean of three independent experiments (n = 3). Source data are provided as a Source data file.

