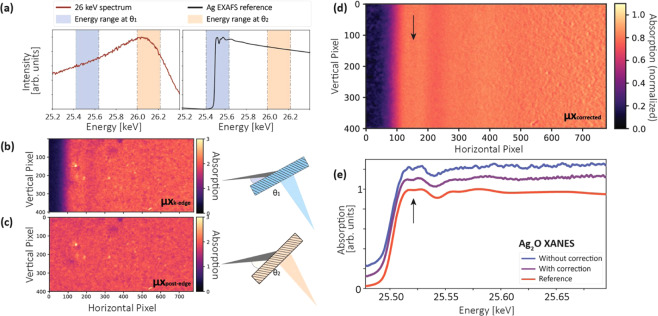
Figure 5.
Concentration correction method for an inhomogeneous sample. A rectangular region-of-interest (ROI) with a size of 780 × 400 pixels was chosen for all images. (a) The source spectrum and a reference Ag2O extended x-ray absorption fine structure (EXAFS) spectrum. In addition to the absorption measured at the K-edge (blue energy range), another measurement was carried out at higher energies (orange energy range). (b) The cropped 2d absorption images for measurements with the Laue crystal at rotation angle θ1 and (c) rotation angle θ2. (d) The concentration-corrected image was calculated using the the local thickness extracted from the image recorded at θ2. (e) Compared with the Ag2O x-ray absorption near edge structure (XANES) spectrum without concentration correction (blue curve), the quality of the corrected data is greatly improved.

