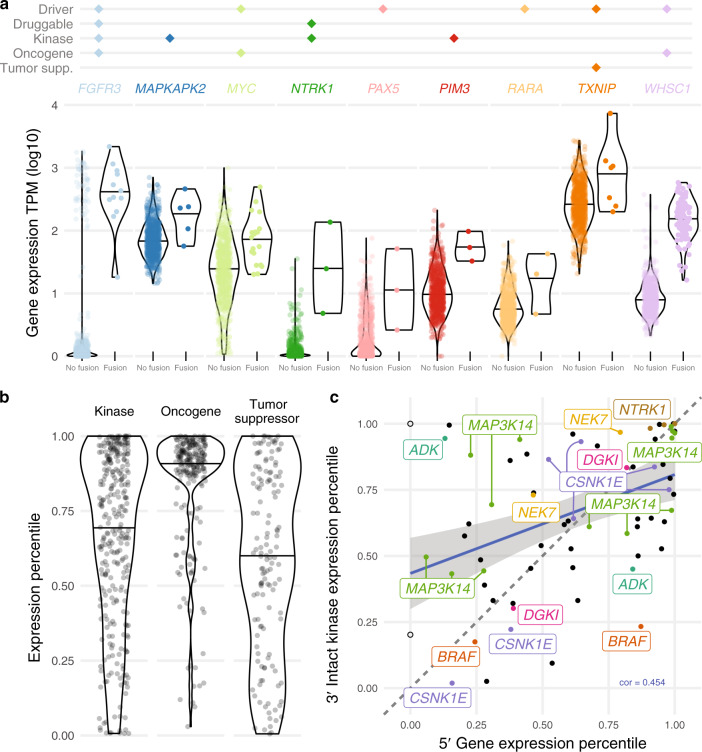
Fig. 2. Expression of cancer-related genes.
a Significantly overexpressed fusion genes. Violin plots defined as: FGFR3 no fusion (n = 730, minimum = 0.00, maximum = 3.26, median = 0.05), fusion (12, 1.26, 3.34, 2.58); MAPKAPK2 no fusion (737, 1.16, 2.85, 1.83), fusion (5, 1.75, 2.66, 2.36); MYC no fusion (723, 0.03, 3.00, 1.39), fusion (19, 1.30, 2.69, 1.89); NTRK1 no fusion (739, 0.00, 1.55, 0.03), fusion (3, 0.68, 2.13, 1.39); PAX5 no fusion (739, 0.00, 1.88, 0.11), fusion (3, 0.42, 1.71, 1.05); PIM3 no fusion (739, 0.00, 2.32, 0.99), fusion (3, 1.51, 1.99, 1.73); RARA no fusion (739, 0.00, 1.83, 0.75), fusion (3, 0.67, 1.63, 1.31); TXNIP no fusion (735, 1.31, 3.43, 2.41), fusion (7, 2.3, 3.87, 3); WHSC1 no fusion (645, 0.33, 2.57, 0.91), fusion (97, 1.21, 2.77, 2.19). All data points from 0 to 100th percentile are shown. b Expression percentile distribution for different gene classes. Violin plots defined as: Kinase (n = 298, minimum = 0.01, maximum = 1.00, median = 0.74); Oncogene (224, 0.03, 1.00, 0.92); Tumor Suppressor (137, 0.01, 1.00, 0.61). All data points from 0 to 100th percentile are shown. c. 5′ and 3′ gene expression of fusions with intact 3′ kinase genes. The two empty circles have no expression value for the 5′ gene (IGH, IGL). Labels refer to genes appearing more than once. Source data and scripts are available at 10.6084/m9.figshare.11941494.

