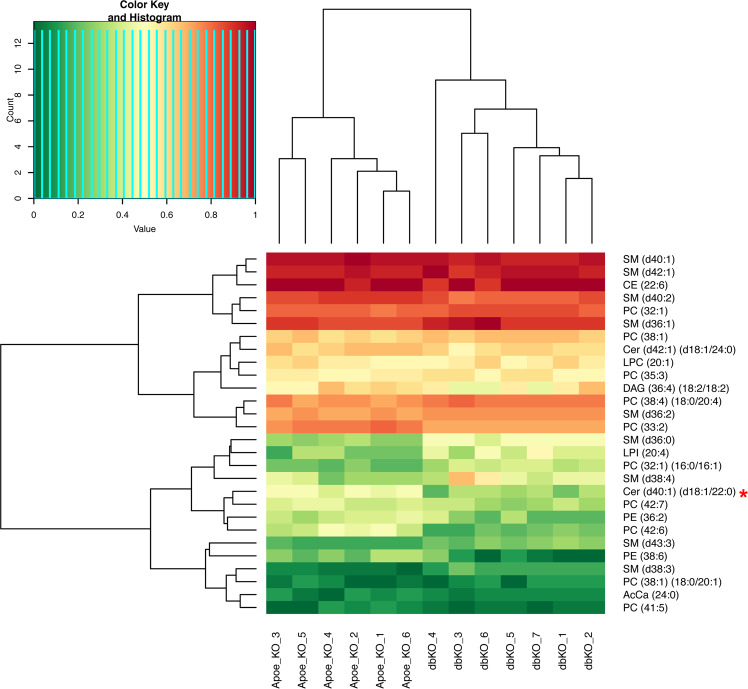
Figure 4.
Heatmap representing lipid species showing differences in levels between XY mice with a Cyp17a1 (d/d) x Apoe (d/d) (dbKO) and Cyp17a1 (+/+) x Apoe (d/d) (Apoe_KO) genotype. Lipids were extracted from plasma samples and evaluated by LC-MS. The levels of each lipid species were set from 0 to 1. The heatmap shows the difference in levels of lipid species between CYP17A1 deficient double KO mice (dbKO) and controls (Apoe_KO) mice. The asterisk (*) indicates lipid species with significantly different levels after correction for multiple testing (Bonferroni-corrected P-value threshold of 2.1 × 10⁻⁴ (0.05/234 all lipid species)).

