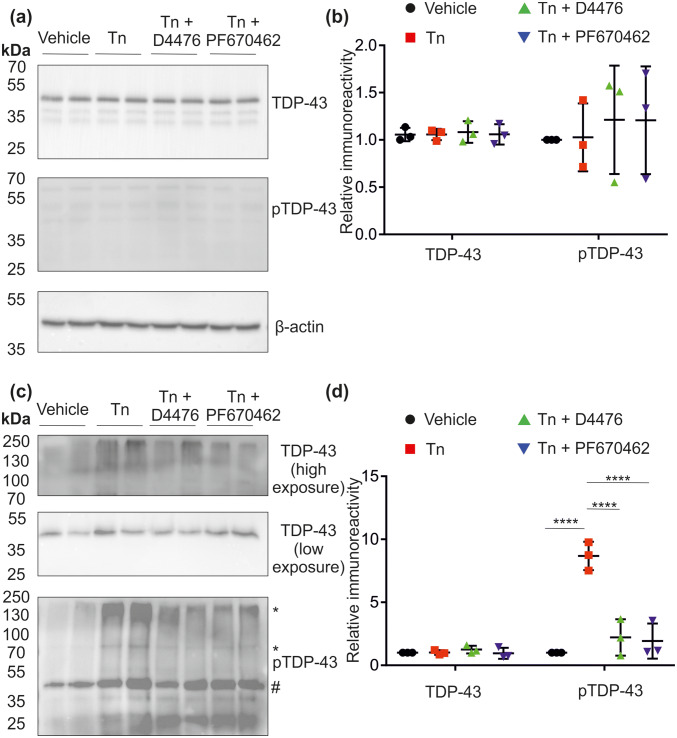
Fig. 4.
Fractionation and immunoblot analysis of TDP-43. NSC-34 cells were treated with vehicle control or 0.1 µM tunicamycin (Tn) ± 10 µM D4476 or PF670462. a RIPA-soluble and c RIPA-insoluble/urea-soluble fractions were prepared, followed by SDS-PAGE and immunoblot, probing for TDP-43 and pTDP-43. Densitometric analysis was performed on blots from the soluble fraction (b) and the insoluble fraction (d). Phospho-TDP-43 densitometry represents the 80 kDa immunoreactive band. * = high molecular weight pTDP-43 and # = monomeric pTDP-43. Each point represents a biological replicate (n = 3) with error bars as SD. Statistical significance was assessed using one way ANOVA with Tukey’s post hoc test. Horizontal lines (black) indicate mean and SD

