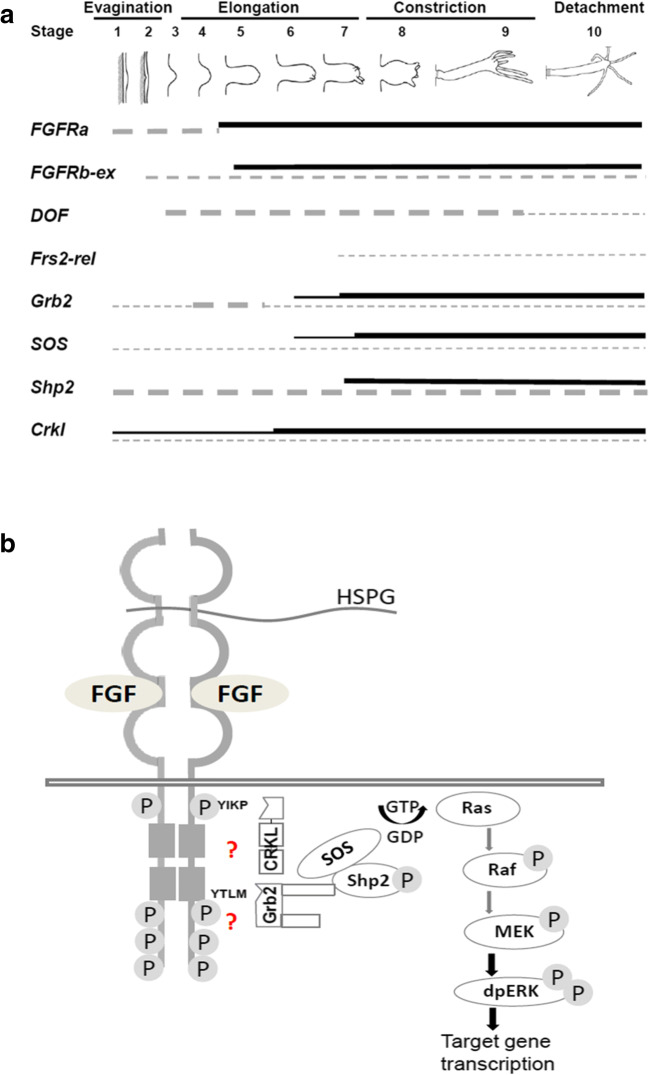
Fig. 4.
Schematic summary of the expression profile and of signaling pathways reached via potential Hydra FGFR downstream elements. (A) Time course of gene expression at the bud base ectoderm (continuous line) or elsewhere in the animal (dotted line). Expression intensity is indicated by line thickness. (B) Hypothetical alternative FGFR pathways in Hydra converging on the Ras/MAPK pathway. The SH2 domain-binding consensus sequences (YIKP, YTLM) in Hydra FGFR for direct binding of Grb2 or Crkl, respectively, are indicated

