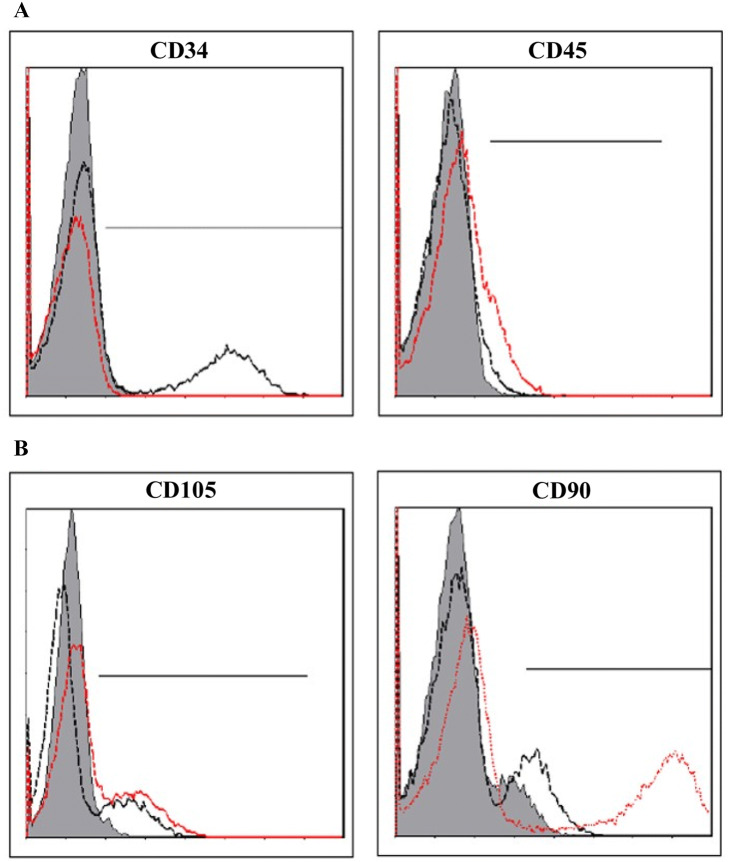
Fig. 2.
Flow cytometry histograms of human SVF. Red and black colored lines represent the specific antibodies indicated. Gray color indicates an isotype of each specific antibody. A Both CD34 and CD45 markers are highly expressed in the hematopoietic cell population. CD34 and CD45 cells have been described as representing about 14% and 7% of the SVF, respectively. B Both CD105 and CD90 markers are highly expressed on ASCs. CD105 and CD90 cells have been described as representing about 24% and 21% of the SVF, respectively

