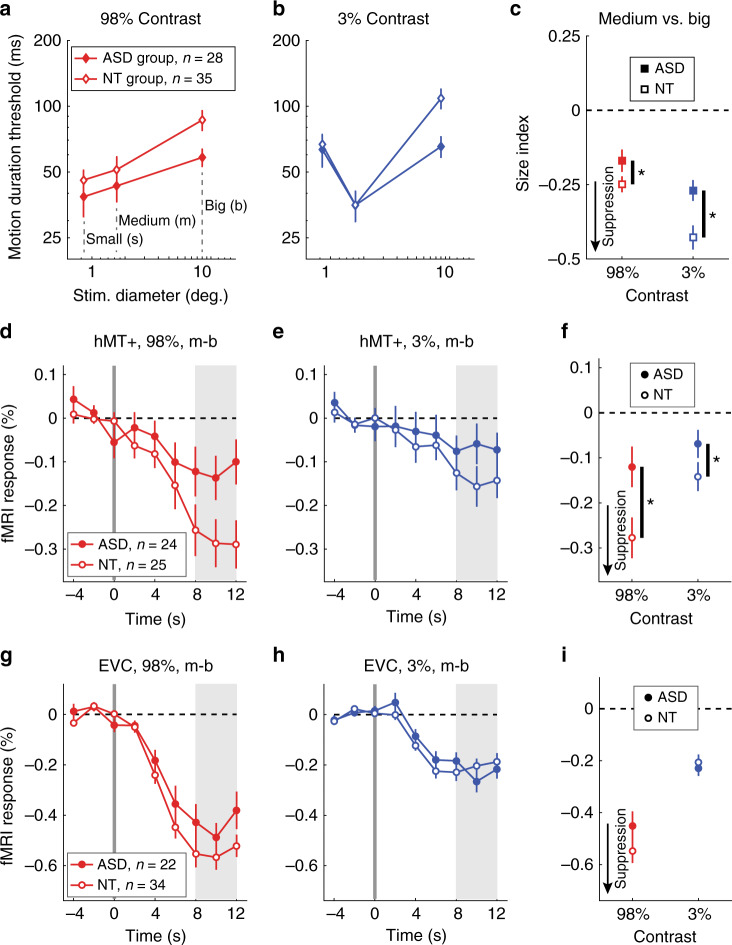
Fig. 2. Behavioral and fMRI results.
a Motion duration thresholds for high-contrast (98%) drifting gratings. The time required to perceive whether stimuli drifted left or right with 80% accuracy is shown on the y-axis for different stimulus sizes (x-axis). b The same, but for low-contrast gratings (3%). c The effect of increasing stimulus size on duration thresholds was quantified using a size index—the difference between log thresholds (Eq. 3). More negative values indicate stronger suppression (black arrow). Participants with ASD show weaker spatial suppression during motion discrimination than NTs (asterisk: ANOVA, main effect of group, p = 0.003). d fMRI responses in foveal human MT complex (hMT+) to an increase in stimulus size; at time = 0 s, high-contrast drifting gratings increased in size from medium (m) to big (b). e The same, but for low-contrast gratings. f Average fMRI responses for each group (from shaded regions in e, f). Suppression of the fMRI response in hMT+ is weaker among participants with ASD (asterisk: ANOVA, main effect of group, p = 0.022). g–i are the same as d–f but for a foveal region of early visual cortex (EVC). Samples sizes for each row are shown in a, d, and g. Dots show group means; error bars are S.E.M.

