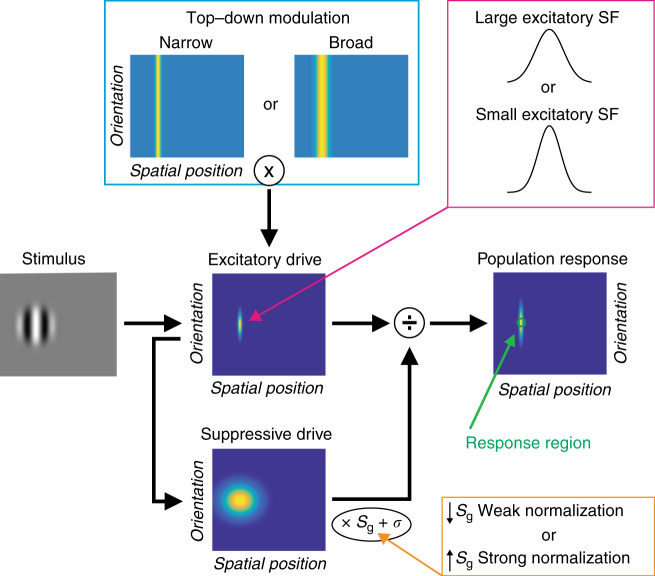
Fig. 4. Normalization model diagram.
For full model details, see Methods and Supplementary Methods. We tested three different model variants, which are described within colored boxes. Orange: Weaker vs. stronger normalization was modeled by lower vs. higher values for the suppressive gain term (Sg), as in previous work2. Magenta: Large vs. small excitatory spatial filters (SFs) were modeled using wider vs. narrower spatial Gaussians in the excitatory drive term (E), as in previous work3. Cyan: Narrow vs. broad top–down modulation was modeled using narrower vs. broader spatial Gaussians in the top–down modulation term (M).

