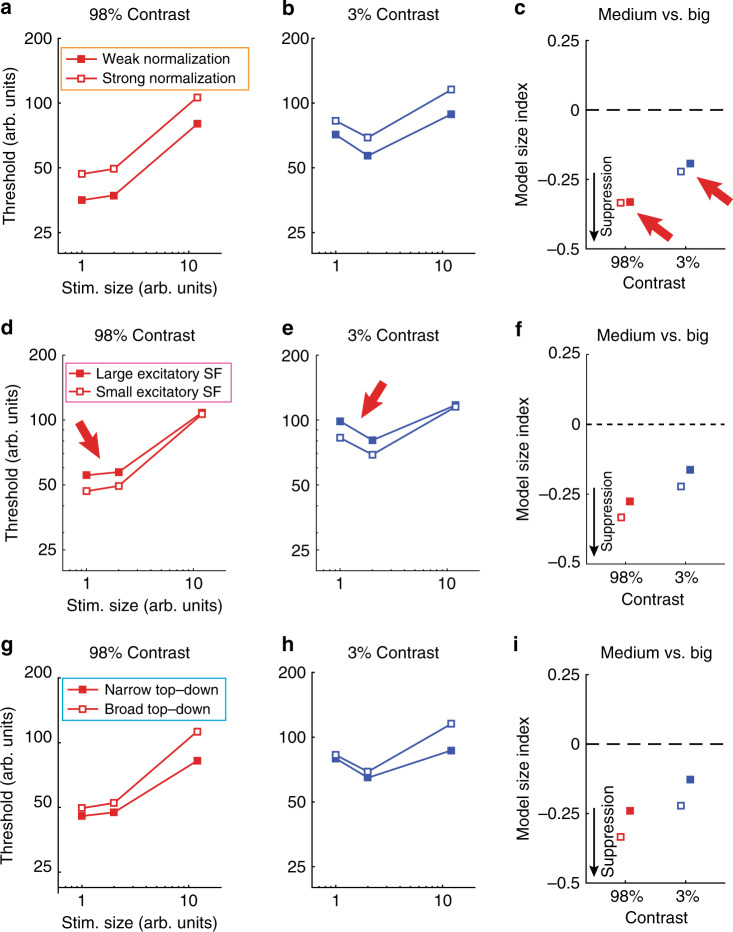
Fig. 5. Normalization model results.
We used a divisive normalization model to describe motion duration thresholds, as in our previous work12. a, b Weaker normalization (25% weaker suppressive gain2) yields lower predicted duration thresholds across stimulus sizes and contrasts. c Size indices are not dramatically altered by weaker normalization. More negative values indicate stronger suppression (black arrow). Red arrows indicate a poor match to our behavioral results from Fig. 2a–c. d–f Larger excitatory spatial filters (25% larger3) yield higher duration thresholds and less negative size indices. Thus neither weak normalization nor larger excitatory spatial filters provide a good match for our observations of lower motion discrimination thresholds for large stimuli among people with ASD (Fig. 2a–c). g, h Narrower top–down modulation (6 vs. 14 arb. units) yields lower thresholds at larger stimulus sizes. i Narrower top–down modulation produces less negative size indices, consistent with weaker suppression, and thus shows a better match to our psychophysical results.

