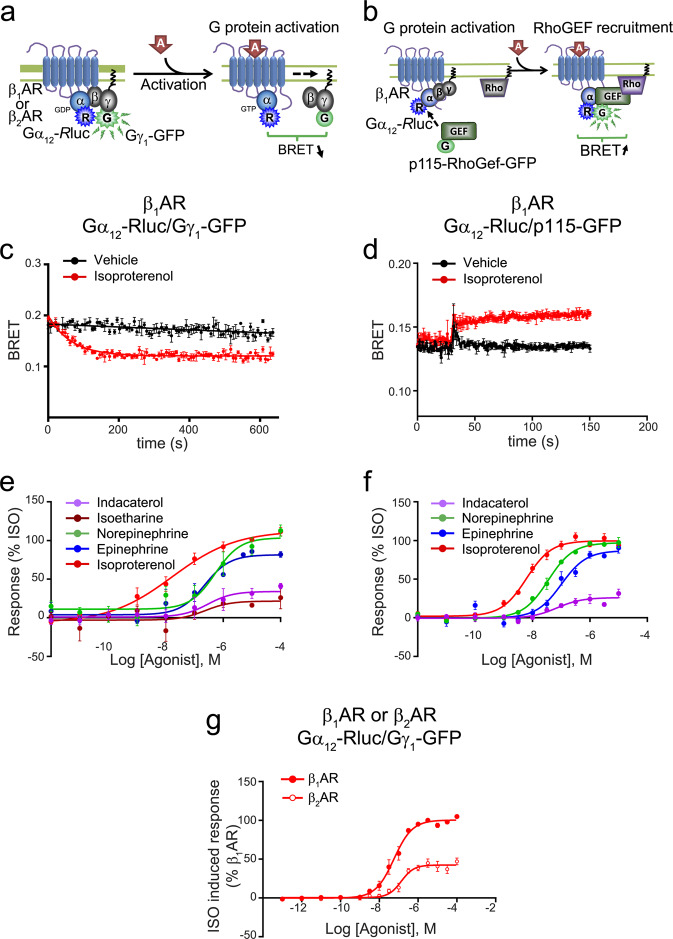
Figure 5.
Gα12-induced activation by the β1AR. (a) Schematic representation of the Gα12-Rluc/Gγ1-GFP biosensor used to study the Gα12 induced βAR signalling. (b) Schematic representation of the Gα12-Rluc/p115-RhoGef-GFP (p115-GFP) biosensor used to study the Gα12 induced βAR signalling. HEK 293 cells were transfected with (c,e,g) Gα12-Rluc, Gγ1-GFP and untagged Gβ1 or with (d,f) Gα12-Rluc, p115-GFP and untagged Gγ1 and Gβ1, along with β1AR or (g) β2AR. Kinetic curves represent time course of (c) Gα12 activation (vehicle and isoproterenol n = 3) or (d) Gα12-p115 biosensor activation (vehicle n = 2, isoproterenol n = 3), expressed as absolute BRET ratio. Concentration-responses curves for (e) Gα12 activation or (f) Gα12-p115 biosensor activation following β1AR activation by indicated ligands. (g) Concentration-responses curves for Gα12 activation following isoproterenol-induced β1AR or β2AR stimulation (n = 6). Data were normalized to maximal isoproterenol response (100%), and are expressed as mean ± SEM values. Detail (e,f) of the number of experiments, maximal responses, pEC50 values and statistical comparisons of curve parameters for (e,f) β1AR activation by different ligands are provided in Supplementary Tables S1 and S2.

