Figure 6.
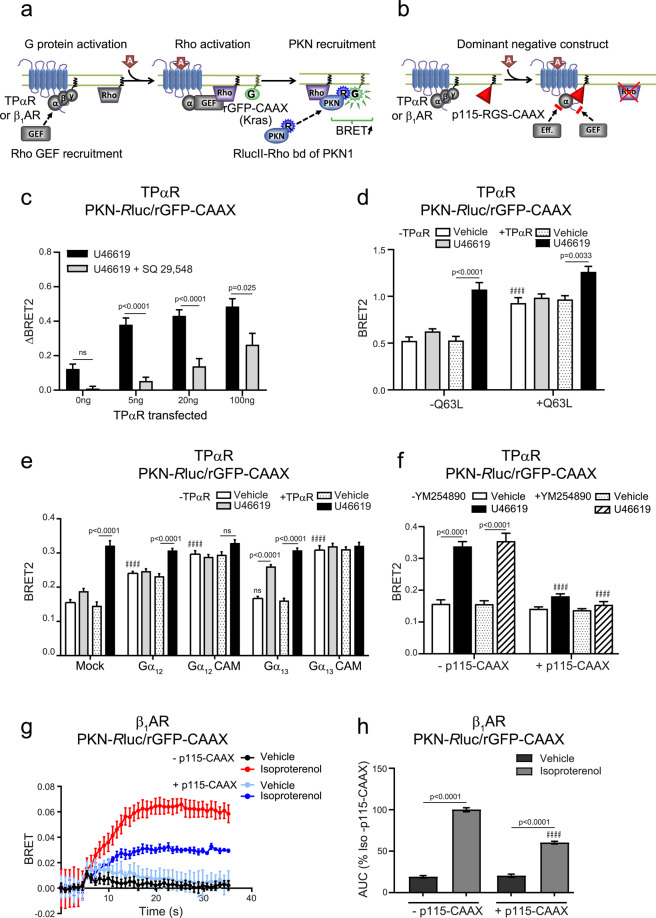
PKN-recruitment based biosensor to monitor receptor-induced activation of Rho signalling for TPαR and β1AR. (a) Schematic representation of the PKN-recruitment based biosensor. (b) Schematic representation of the mode of action of p115-RGS-CAAX construct (P115-CAAX) as a dominant negative construct for G protein signalling. HEK 293 cells were transfected with PKN-RlucII and rGFP-CAAX along with either (c–f) HA-TPαR or (g,h) β1AR, in the presence or absence of (d) constitutively active RhoA mutant (Q63L), (e) Gα12, Gα13 or their constitutively active (CAM) versions (Gα12CA Q231L and Gα13CA Q226L) or (f-h) p115-CAAX. (c) Treatment with the TP antagonist SQ 29,548 inhibits PKN recruitment following TPαR activation by U46619. 0 ng represents the activity of endogenously expressed receptor. Data are expressed as ΔBRET signal and are the mean ± SEM (n = 3). Statistical comparisons for antagonistic effect were done using two-way ANOVA followed by post-hoc comparison with Sidak’s test. (d,e) PKN recruitment to the plasma membrane upon U46619-induced TPαR activation in the presence or absence of (d) constitutively active RhoA mutant (Q63L) or (e) Gα12, Gα13 or their CAM versions. Data are expressed as BRET signal and are mean ± SEM ((d) n = 6, (e) n = 3). Statistical comparisons were done using two-way ANOVA followed by post-hoc comparison with Tukey’s test. #### p < 0.0001 compared to (d) Q63L or (e) TPαR Vehicle Mock. (f) Inhibition of PKN recruitment upon U46619-induced TPαR activation in the presence of the dominant negative p115-CAAX construct or the Gq inhibitor YM-254890. Data expression and statistical comparisons were done as in (d,e). n = 4, #### p < 0.0001 compared to -p115-CAAX. (g) Kinetics of PKN recruitment upon isoproterenol-induced β1AR activation in the presence of the dominant negative p115-CAAX (representative of n = 3). (h) β1AR-mediated PKN recruitment in the presence of p115-CAAX. Data are expressed as the area under the curve (AUC), calculated from 30 sec kinetics of 1 µM isoproterenol stimulation, and are the mean ± SEM (n = 4). #### p < 0.0001 compared to -p115-CAAX. ns: non-significant.

