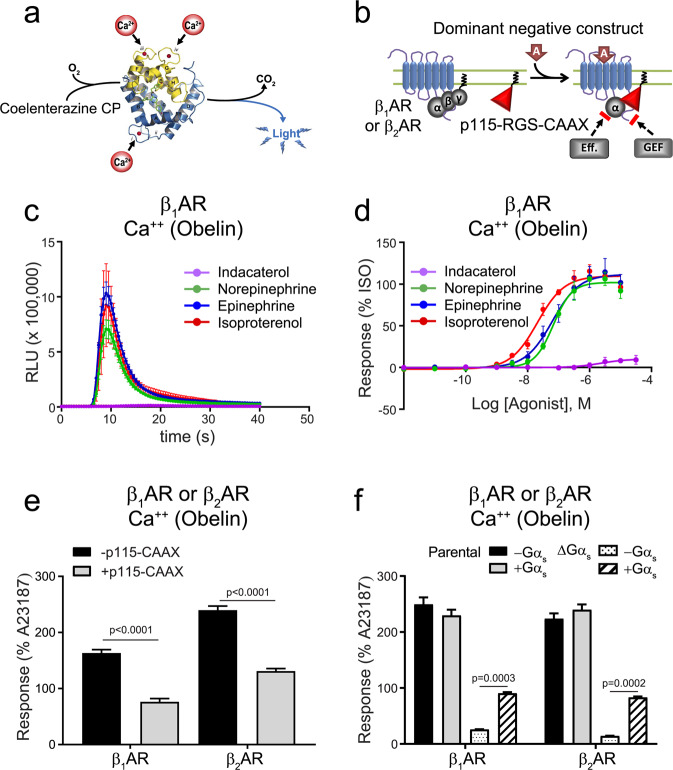
Figure 7.
Calcium response promoted by β1AR or β2AR activation. (a) Schematic representation of the luminescence Obelin biosensor used to detect calcium. (b) Schematic representation of the mode of action of p115-RGS-CAAX (p115-CAAX) construct as a dominant negative construct for the inhibition of G12/13 signalling. HEK 293 cells stably expressing HA-β1AR were transfected with Obelin. (c) Kinetics of calcium response by indicated ligands (representative, isoproterenol, n = 10, other ligands n = 3) and expressed as relative luminescence units. (d) Concentration-responses curves for Ca2+ mobilization following β1AR activation by indicated ligands. Data were normalized to maximal isoproterenol response (100%), and expressed as mean ± SEM values. Detail of the number of experiments, maximal responses, pEC50 values and statistical comparisons of curve parameters for different ligands are provided in Supplementary Tables S1 and S2. (e) HEK 293 cells were transiently transfected with β1AR or β2AR along with the obelin biosensor, with or without the p115-CAAX inhibitor. Data were normalized to maximal A23187 response (100%), determined from the area under the curve (AUC), and are expressed as the mean ± SEM values (n = 3). Statistical comparisons were done using two-way ANOVA followed by post-hoc comparison with Tukey’s test. (f) Parental HEK 293 or ΔGαs cells were transfected with β1AR or β2AR, along with obelin, with or without Gαs. Data normalization and statistical analysis were done as described in (e) (n = 3).

