Figure 2.

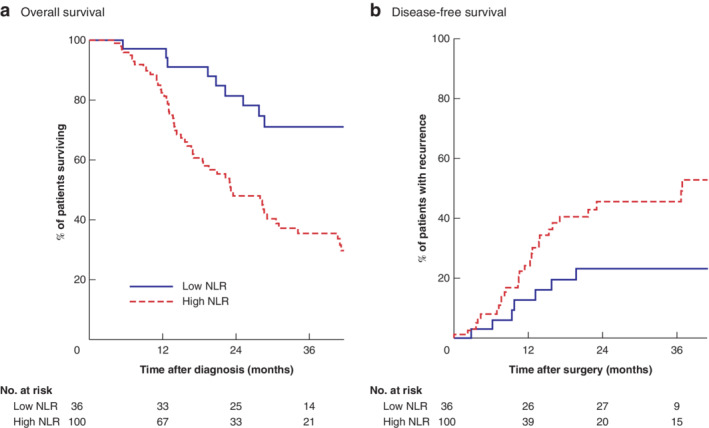
Kaplan–Meier analysis of overall and disease‐free survival in relation to neutrophil to lymphocyte ratio
a Overall and b disease‐free survival. NLR, neutrophil to lymphocyte ratio. a P = 0·001, b P = 0·027 (log rank test).

Kaplan–Meier analysis of overall and disease‐free survival in relation to neutrophil to lymphocyte ratio
a Overall and b disease‐free survival. NLR, neutrophil to lymphocyte ratio. a P = 0·001, b P = 0·027 (log rank test).