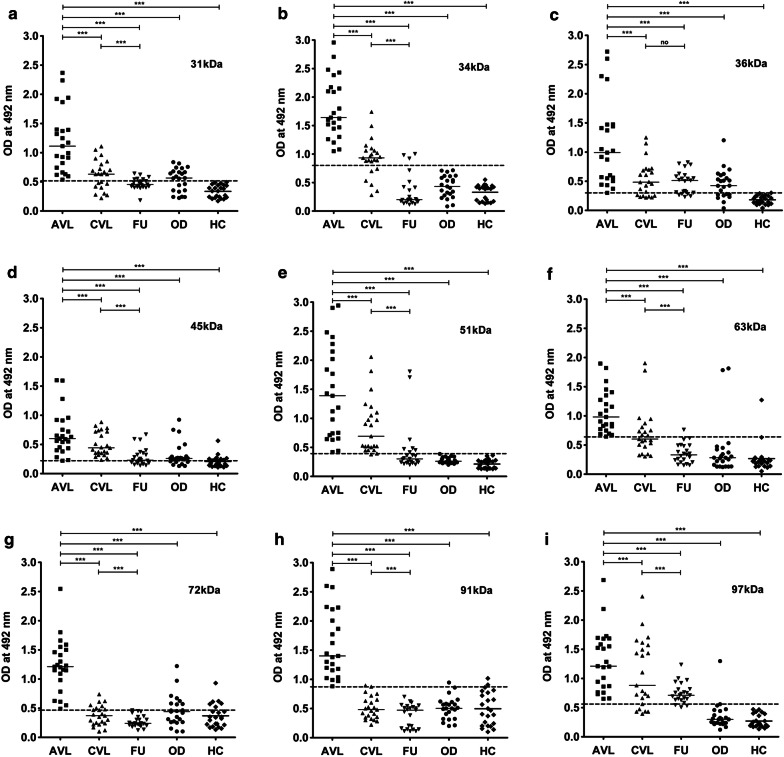
Fig. 4.
Indirect ELISA using electroeluted antigens. IgG reactivity of eluted antigens 31 (a), 34 (b), 36 (c), 45 (d), 51 (e), 63 (f), 72 (g), 91 (h) and 97 kDa (i) with serum samples from 23 VL patients at three different time points that is active VL before the treatment (AVL), after one month cured VL (CVL), and after six months follow-up cases (FU). The study also included sera from symptomatically similar other diseases (OD; n = 23) and healthy controls (HC; n = 23). The horizontal lines denote the mean value for each group. The dotted lines denote the cut-off values selected from the ROC curve where maximum sensitivities and specificities were achieved. Each point represents an average of triplicate values obtained from a single sample

