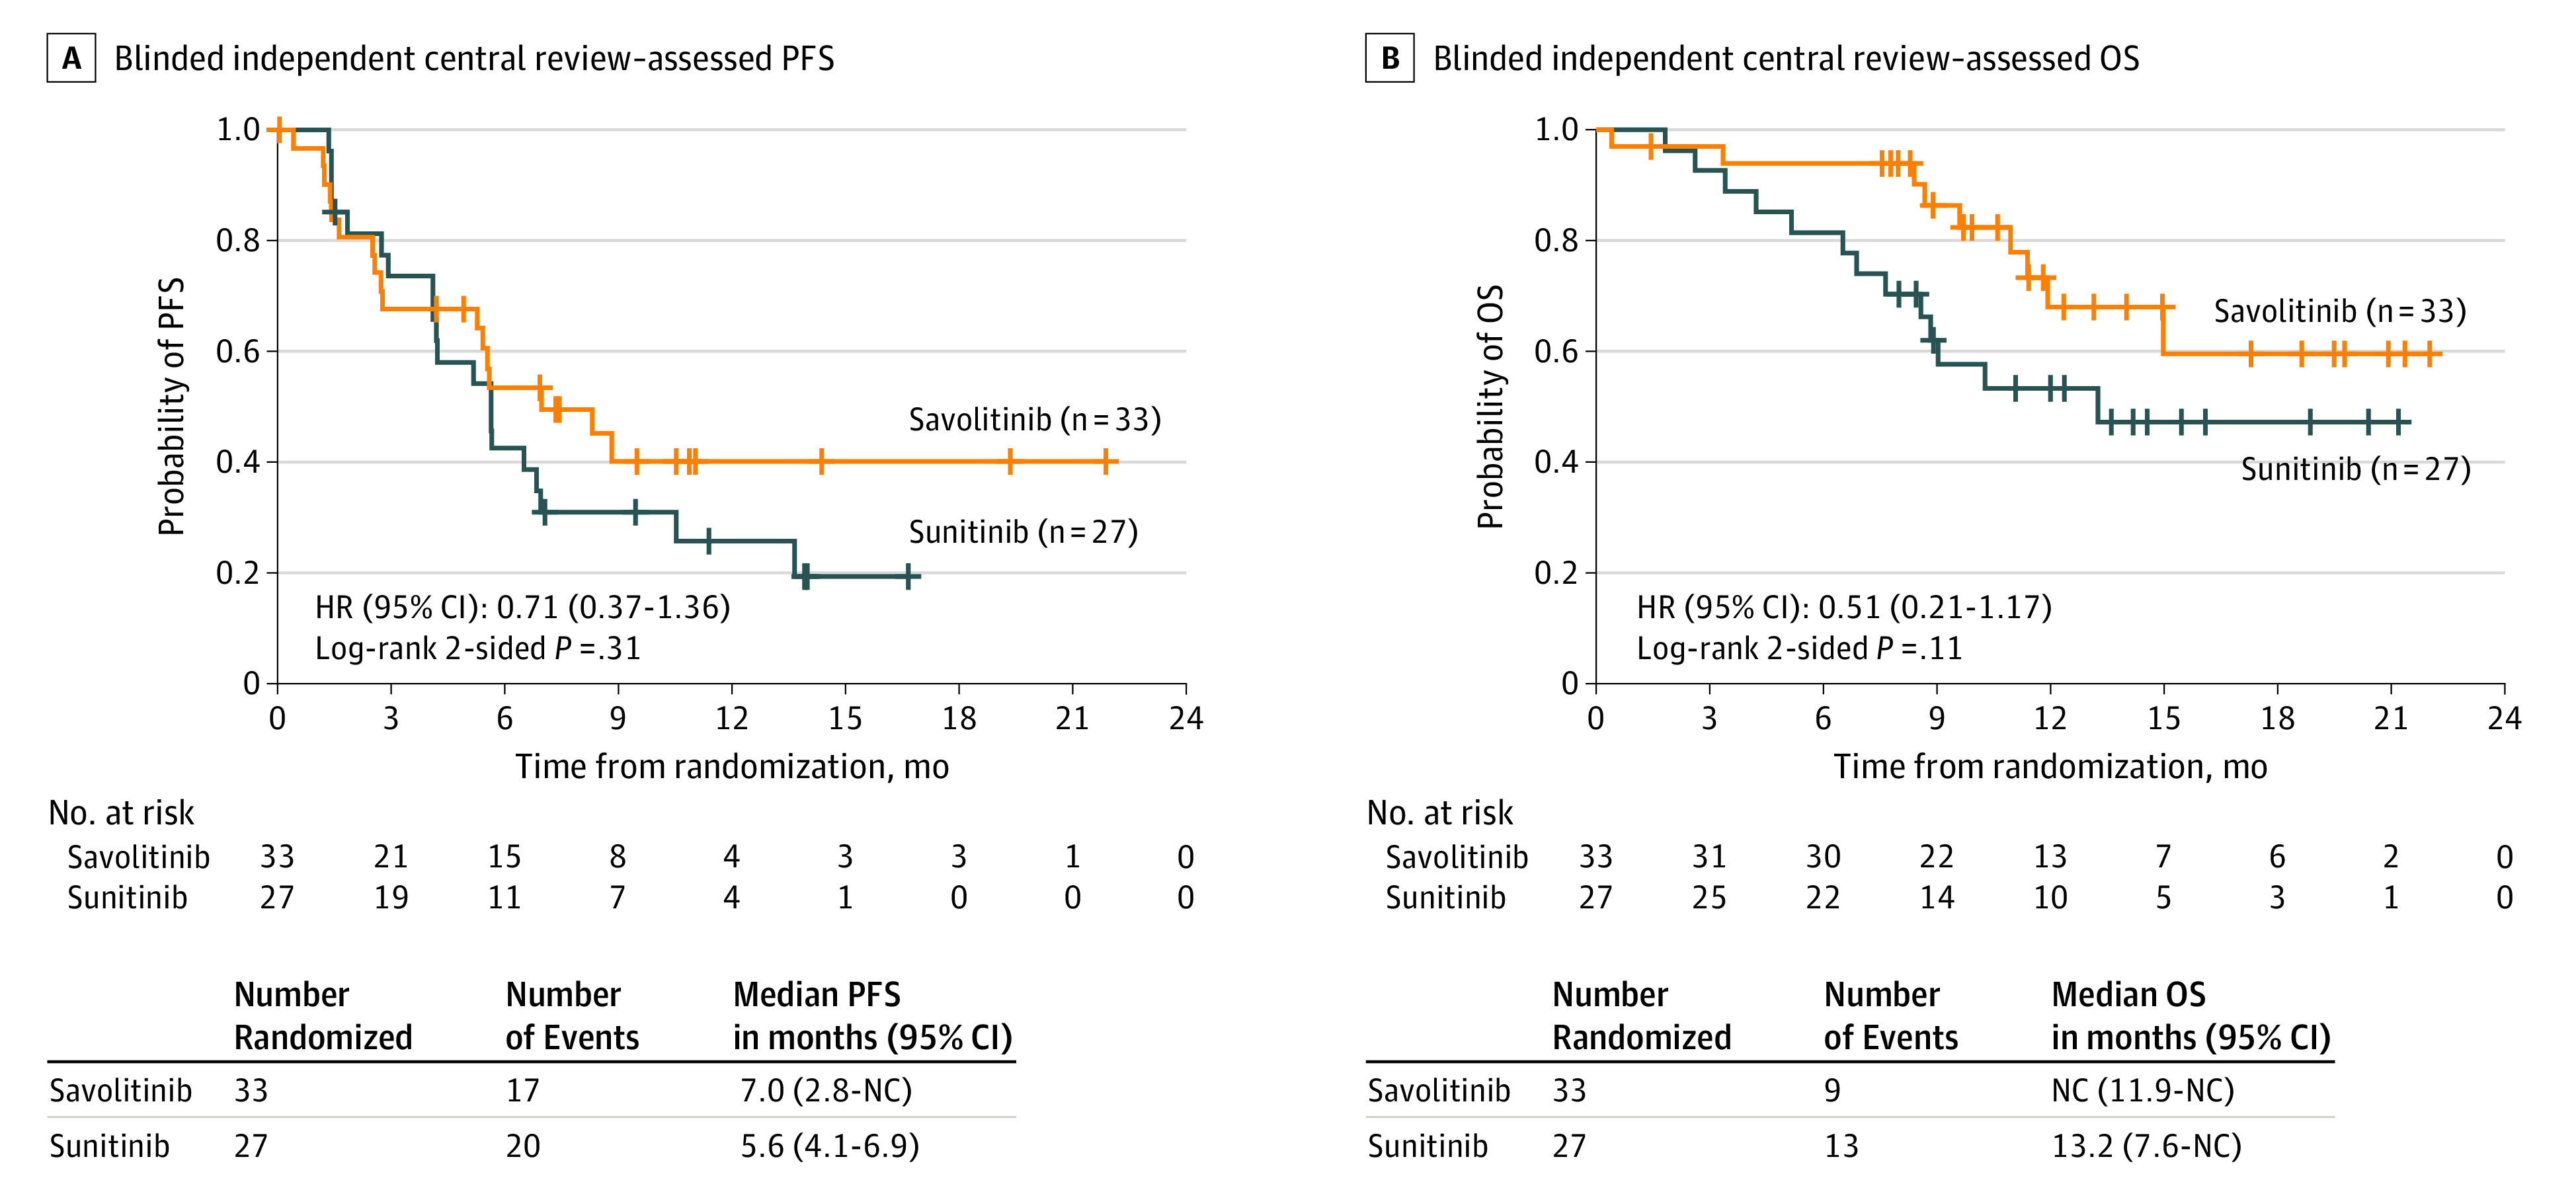
Figure 2. Kaplan-Meier Curves.

BICR indicates blinded independent central review; HR, hazard ratio; NC, not calculated; OS, overall survival; PFS, progression-free survival.

BICR indicates blinded independent central review; HR, hazard ratio; NC, not calculated; OS, overall survival; PFS, progression-free survival.