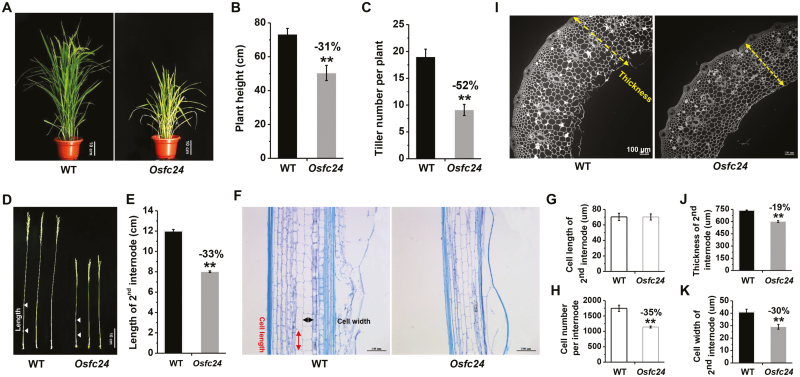
Fig. 2.
Characterization of cell growth in the rice Osfc24 mutant. (A) The phenotypes of wild-type (WT) and Osfc24 plants at the heading stage. (B) Plant height and (C) tiller numbers of plants at the heading stage. Data are means (±SD) of n≥20 replicates. (D) Images of whole stems and (E) the length of the 2nd internodes as illustrated in (D). Data are means (±SD) of n≥20 plant main stems. (F) Longitudinal sections of the 2nd internode. The measurements of cell length and width are indicated. (G) Cell length and (H) cell number of the 2nd internode as illustrated in (F). (I) Transverse section of the 2nd internodes as shown in (D), with the measurement of thickness indicated. (J) Quantification of stem thickness and (K) cell width of the 2nd internodes. Data are means (±SD) of n≥50 cells from sections of three plants (G, K) and n≥20 main stem internodes (H, J). Significant differences between the WT and mutant were determined using Student’s t-test: **P<0.01. Percentage changes relative to the WT are indicated.

