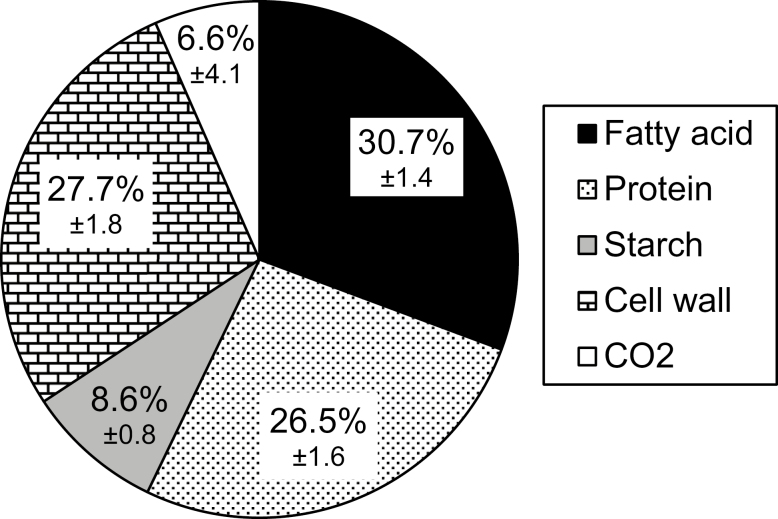
Fig. 2.
The percentage distribution of carbon among biomass fractions. The highest to the lowest carbon sinks (mol C per embryo) are in the order of fatty acid (black), cell wall (bricks), protein (dots), and starch (gray). The difference between carbons in the consumed substrates and in biomass components represents the carbons released as CO2 (white). The overall CCE is 93.4%. Values are the average of three biological replicates ±SD.

