Fig. 4.
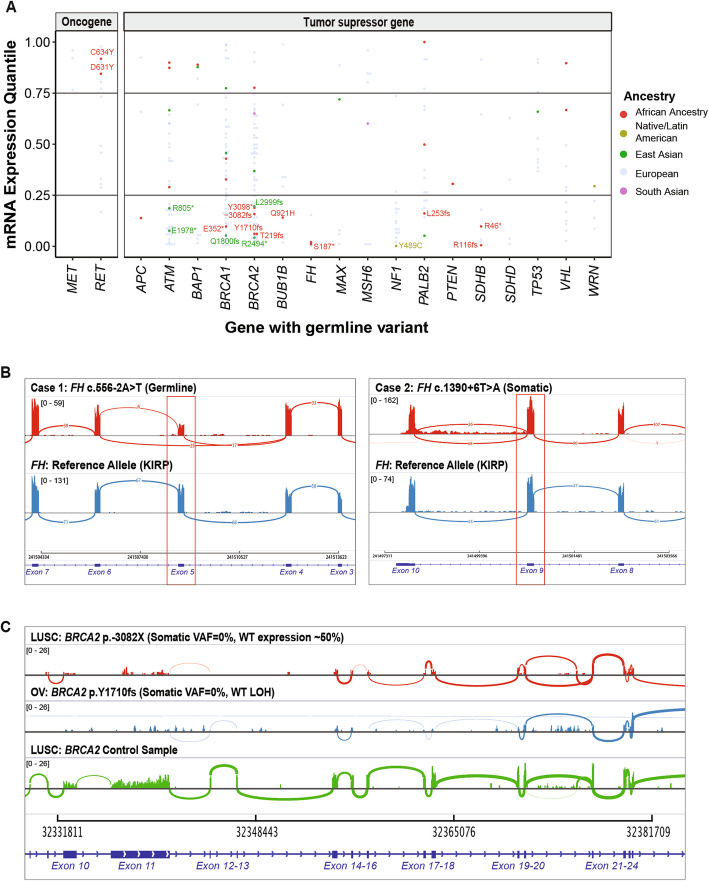
Expression changes associated with the predisposing variants. a mRNA gene expression of the affected genes in the carriers of ancestry-specific variants as quantiles in their respective cancer cohort. Each dot denotes the gene expression level of a predisposing variant carrier colored by ancestry. Non-European variants corresponding to the bottom 25% expression in affected tumor suppressor genes and top 25% expression in affected oncogenes are further labeled. b Tumor RNA expression highlighting (red box) mis-spliced exon 5 with germline or somatic splice site variants in two cases with FH splice site variants as visualized using the integrated genome viewer (IGV). c Tumor RNA expression for the BRCA2 gene. The first two rows correspond to samples with a germline predisposing variant coupled with or without somatic LOH event, respectively. The third row corresponds to an unrelated sample without any BRCA2 alteration. All three coverage plots are group-scaled to show lower expression in the two samples harboring BRCA2 alterations

