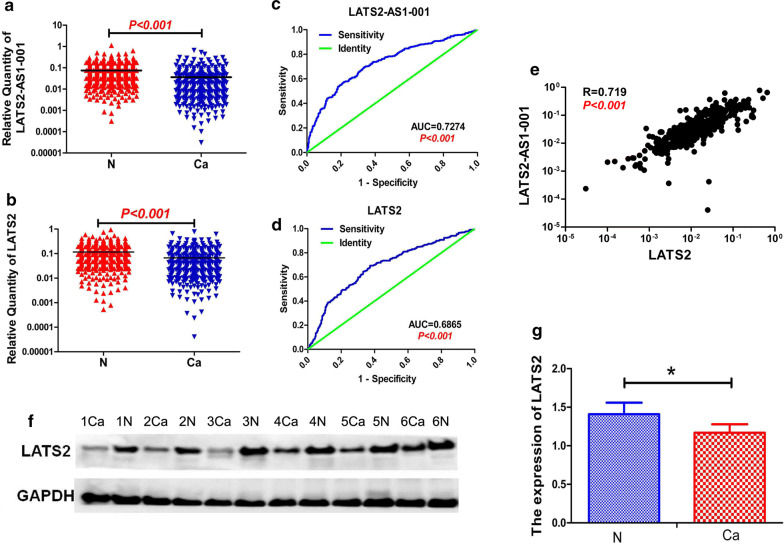
Fig. 1.
LATS2-AS1-001 and LATS2 expression levels are lower in GC compared with matched normal gastric mucosa. LATS2-AS1-001 and LATS2 expression levels were detected by qRT-PCR. Both LATS2-AS1-001 (a) and LATS2 (b) were downregulated in GC tissues compared with the normal gastric mucosa. The receiver operating characteristic (ROC) curves of LATS2-AS1-001 and LATS2 were constructed to assess the respective diagnostic values. Areas under curves for LATS2-AS1-001 (c) and LATS2 (d) were 0.7274 and 0.6865, respectively (P < 0.001). Correlation analysis was carried out to confirm a strong positive correlation between LATS2-AS1-001 and LATS2 mRNA expression levels (e, r = 0.719, P < 0.001). Western blot was performed to evaluate LATS2 protein expression in GC tissues. Consistent with mRNA expression, LATS2 protein levels were decreased in GC tissues compared with the normal gastric mucosa (f, g)

