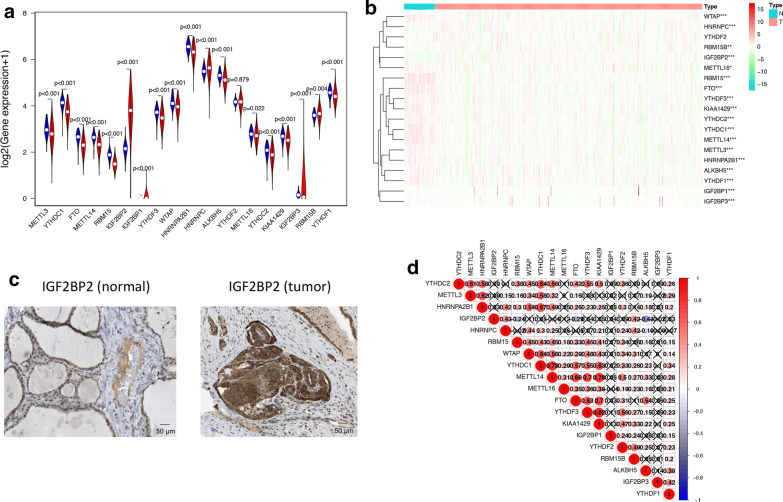
Fig. 1.
The overview of m6A RNA methylation regulators in PTC. a A Vioplot which visualized the differentially expressed m6A regulators in PTC (blue represents normal tissues and red represents tumor tissues). b The mRNA levels of 19 m6A regulators in PTC. Red means this gene is up-regulated while green means this gene is down-regulated (*P < 0.05, **P < 0.01, ***P < 0.001). c The validation of IGF2BP2 expression level by immunohistochemical staining. The result showed that the expression level of IGF2BP2 was higher in PTC tissue than normal thyroid tissue. d Spearman correlation analysis of the 19 m6A regulators in PTC. The “X” represents that the correlation between this pair of genes does not have statistical significance (P > 0.05). The number in every box is the Spearman correlation coefficient between two genes

