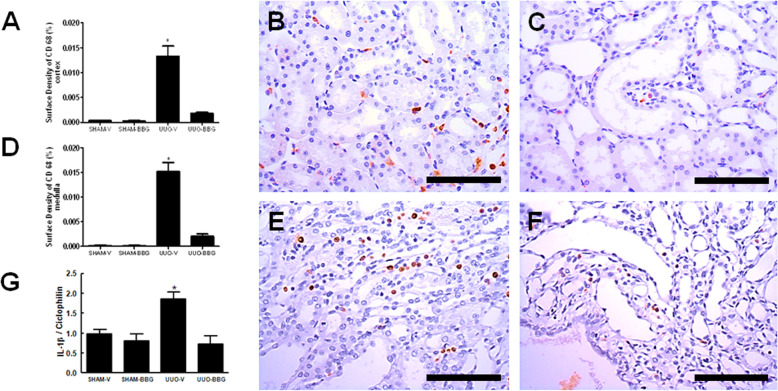
Fig. 2.
BBG and inflammation. BBG reduces the infiltration of macrophages in the renal interstitium and the mRNA expression of IL1-β in UUO. a Graphical representation of CD68 surface density in tubular cells in renal cortex. The graphic presents aligned dot plot and mean ± SEM of 20 captured images of each kidney in the different experimental groups. * p < 0.05 vs UUO-BBG and both SHAM groups. # p < 0.05 vs UUO-V and both SHAM groups. b Representative immunostaining of the renal cortex from UUO-V group. c UUO-BBG group. d Graphical representation of CD68 surface density in tubular cells in renal medulla. The graphic shows aligned dot plot and the mean ± SEM of 20 captured images of each kidney in the different experimental groups. * p < 0.05 vs UUO-BBG and both SHAM groups. # p < 0.05 vs UUO-V and both SHAM groups. Representative immunostaining of the renal cortex from (e) UUO-V group and (f) UUO-BBG group. All pictures of the sham control groups are shown in the supplement. Bar = 100 μm in all Figs. (g) Graphical representation of the mRNA expression of IL1-β by semiquantitative RT-PCR. Quantification of densitometric values obtained from the ratio IL1-β /Ciclophilin (mean ± SEM, n = 5) under the 3 experimental conditions indicated on the abscissa. * p < 0.05 vs UUO-BBG and both SHAM groups

