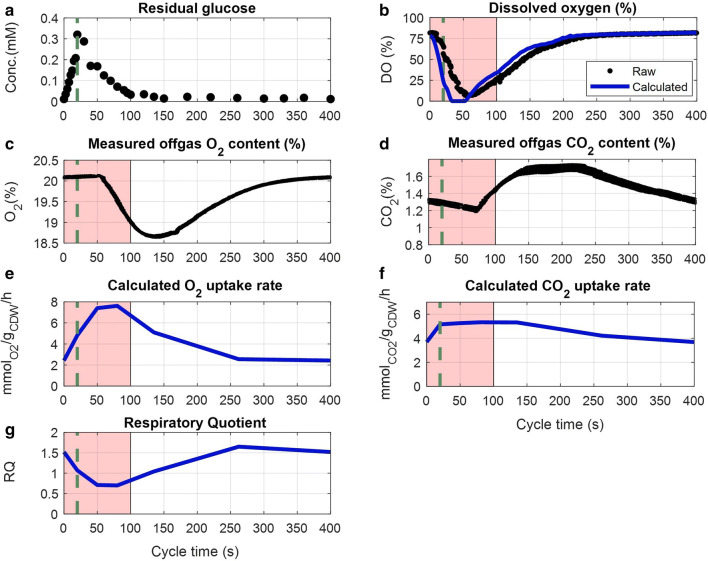
Fig. 2.
Measured concentrations and calculated rates during the feast–famine cycle (s), approximately eight generations after the beginning of the regime. a Residual glucose concentration (mM), quantified by GC–MS/MS. b Dissolved oxygen concentration (%) in the broth, raw data (black) and calculated, eliminating delays of the used Clark probe (blue). c Measurements of oxygen content in offgas (%). d Measurements of carbon dioxide content in offgas (%). e Calculated oxygen uptake rate (/gCDW/h) based on the headspace and tubing offgas delays. f Calculated carbon dioxide production rate (/gCDW/h) based on the headspace, tubing offgas delays and bicarbonate in the broth. g Respiratory quotient (RQ) over time derived from the calculated and . Data of 16 successive cycles are overlapped for DO, O2 and CO2 (b–d). The pink area in the plots represents the substrate feast phase. Green vertical dashed lines show the end of the feeding (20 s)

