Figure 4.

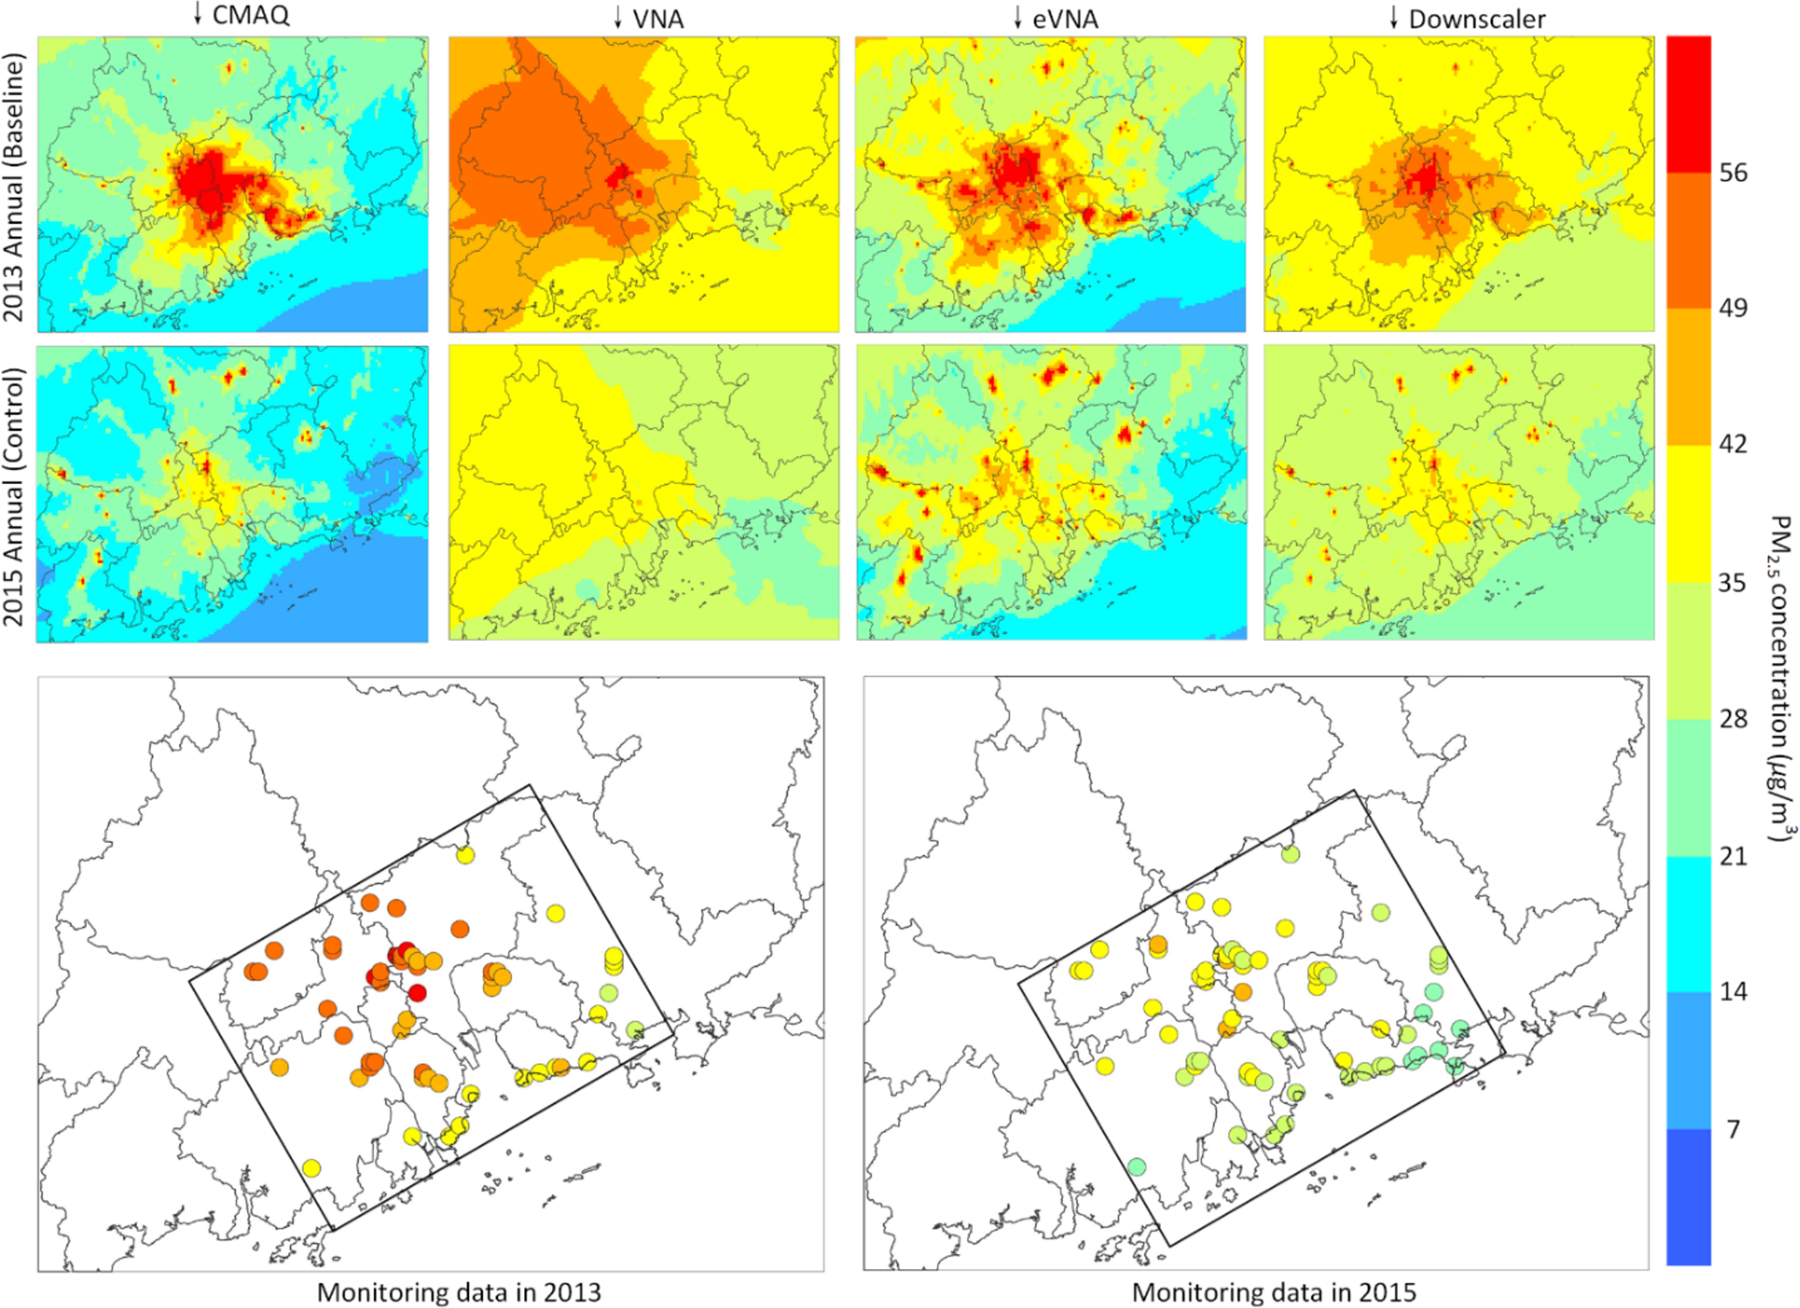
Spatial distribution of CMAQ, VNA, eVNA and DS, and monitoring data. Note: Circles represent the monitoring sites; Regions beyond the rectangle are unmonitored suburban parts of the PRD.

Spatial distribution of CMAQ, VNA, eVNA and DS, and monitoring data. Note: Circles represent the monitoring sites; Regions beyond the rectangle are unmonitored suburban parts of the PRD.