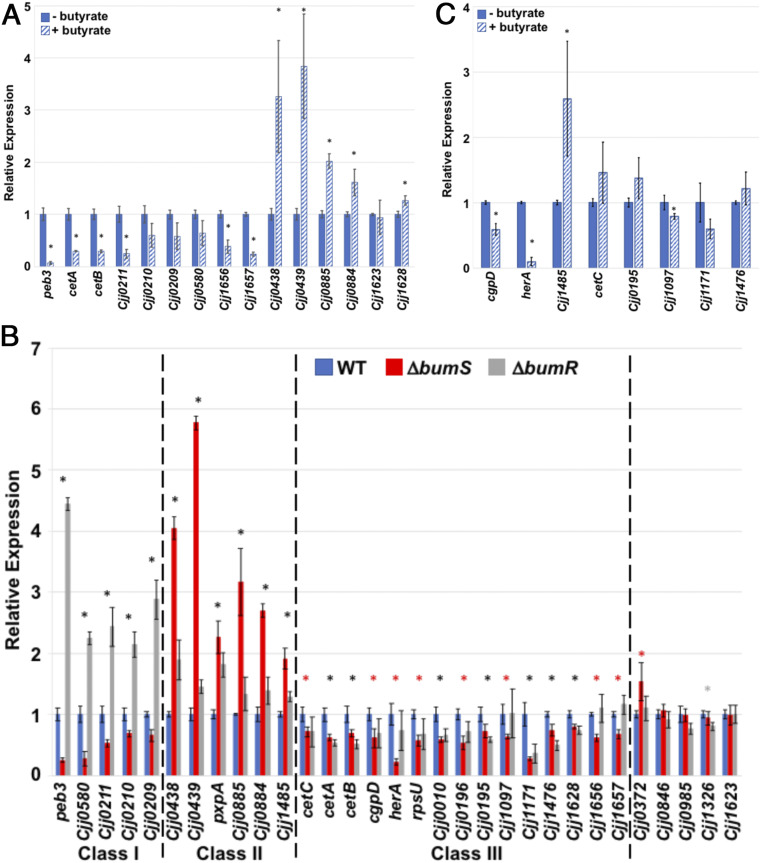
Fig. 4.
Analysis of C. jejuni butyrate-modulated genes and the BumSR regulon. (A) qRT-PCR analysis of transcription of genes initially identified by RNAseq analysis of WT C. jejuni to be modulated in expression by 12.5 mM butyrate during growth in CDM. The expression of each gene in WT C. jejuni grown in CDM alone (solid blue bars) as measured by qRT-PCR was set to 1. Expression of each gene in WT C. jejuni grown in CDM supplemented with 12.5 mM butyrate (hatched blue bars) is shown relative to WT grown in CDM alone. (B) qRT-PCR analysis of transcription of genes initially identified by RNAseq analysis to be altered in C. jejuni ΔbumS and/or ΔbumR relative to WT C. jejuni. The expression of each gene in WT C. jejuni grown in CDM alone (solid blue bars) as measured by qRT-PCR was set to 1. Expression of each gene in ΔbumS (red bars) and ΔbumR (gray bars) is shown relative to WT. Dotted lines indicates divisions between gene sets (classes I to III) show similar effects in expression due to deletion of bumS and/or bumR. (C) Analysis of the ability of BumSR TCS regulon members to be modulated by butyrate for transcription. Select genes that were altered in expression in C. jejuni ΔbumS or ΔbumR were analyzed for butyrate-modulated expression in WT C. jejuni grown in CDM alone (solid blue bars) and in CDM supplemented with 12.5 mM butyrate (hatched blue bars) by qRT-PCR. The expression of each gene in WT C. jejuni grown in CDM alone was set to 1. Expression of each gene in WT C. jejuni grown in CDM supplemented with 12.5 mM butyrate is shown relative to WT grown in CDM alone. For (A–C), results from a representative assay with each sample analyzed in triplicate are shown. Error bars indicate SDs of the average level of expression from three samples. Statistically significant differences in gene expression between WT C. jejuni grown with or without butyrate is indicated by * in A and C (P < 0.05). For (B), different colored asterisks indicate statistically significant differences (P < 0.05) in gene expression between: WT C. jejuni and both ΔbumS and ΔbumR, black *; WT C. jejuni and ΔbumS only, red *; and WT C. jejuni and ΔbumR only, gray * (P < 0.05). Statistical analysis of ΔCT values relative to secD reference gene was calculated by the Student’s t test.

