Fig. 2.
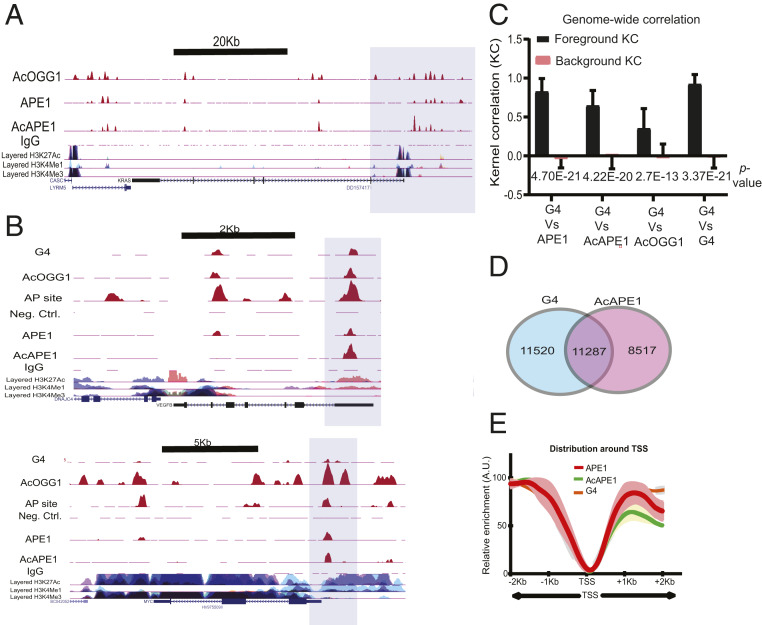
Genome-wide mapping of binding of OGG1 and APE1 repair proteins and G4 structures. (A) The shaded region highlights the overlap of AcOGG1, APE1, and AcAPE1 binding in the KRAS promoter region in A549 cells. (B) Cooccurrence of G4 structures, AP site damage, and binding of AcOGG1, APE1, and AcAPE1 in VEGF and MYC promoter regions (shaded region) which were previously shown to form G4. (C) Genome-wide positional correlations between G4 structures and APE1, AcAPE1, and AcOGG1 were estimated by KC. The bar graph shows the average KC for foreground and background distributions. P values for the difference between foreground and background KC are shown. (D) Venn diagram represents overlapping G4 and AcAPE1 enriched sequences that have a PQS score of ≥20. (E) Metaprofiles of the relative enrichment of G4, APE1, and AcAPE1 with respect to ±2,000 bp of the TSSs of ∼28,000 protein-coding genes in A549 cells. Shaded regions represent the 0.95 CIs.

