Fig. 4.
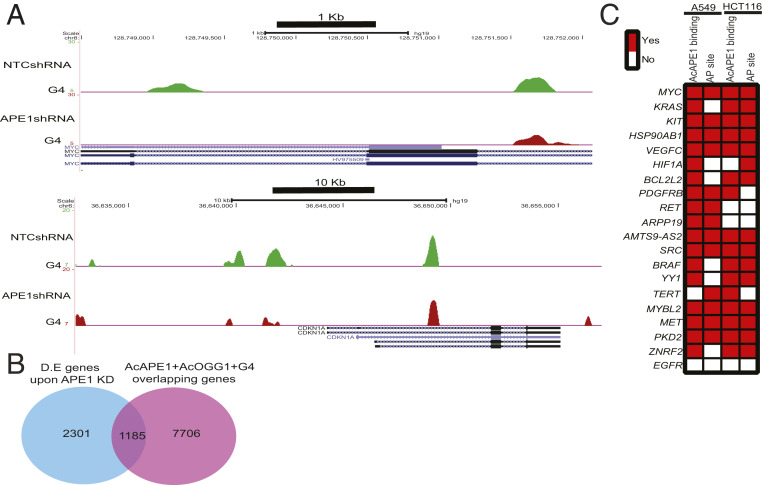
Genome-wide G4 regulation by APE1. (A) A549 cells expressing NTCshRNA or APE1shRNA under a Dox-inducible promoter were treated with Dox (2 µg/mL) for 3 days, and ChIP was performed with α-BG4. Representative genome browser views of MYC and P21 genes showing G4 profiles in control and APE1 KD A549 cells. (B) RNA sequencing analysis of RNA isolated from A549 cells expressing NTCshRNA or APE1shRNA treated with Dox (2 µg/mL) for 3 days. Overlapping between differentially expressed (D.E.) genes and genes with overlapping enrichment of AcOGG1, AcAPE1, and G4. The data are represented as a Venn diagram. (C) The occurrence of AP sites and AcAPE1 binding in G4 containing oncogene promoters.

