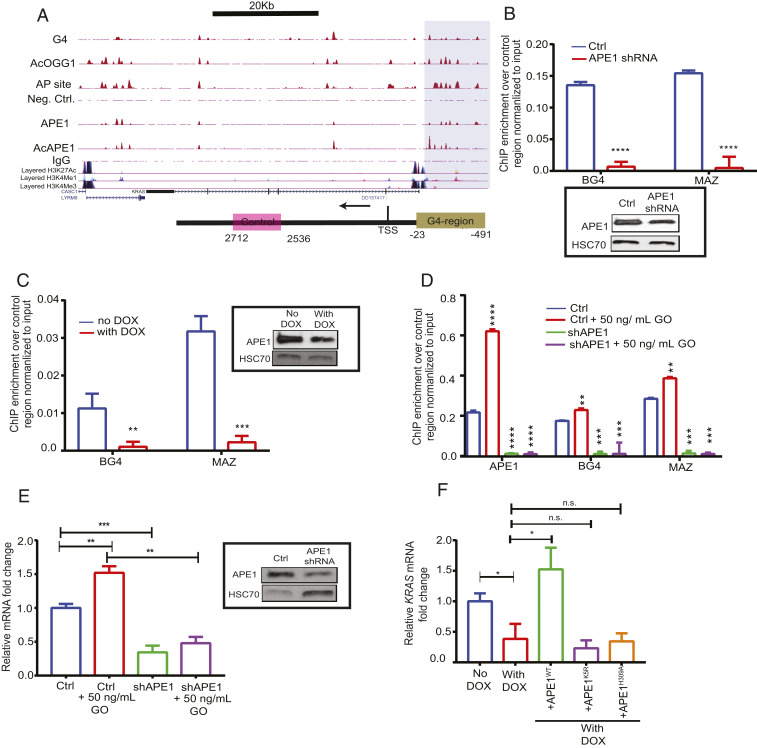
Fig. 5.
APE1 modulates G4-mediated expression of genes. (A). (Top) Overlapping enrichment of G4 structures, AP sites, AcOGG1, APE1, and AcAPE1 in the KRAS gene in A549 cells. The shaded region highlights the established KRAS G4 promoter region which shows overlapping AP site damage, G4, and binding of AcOGG1, APE1, and AcAPE1. (Bottom) The shaded region of the schematic highlights the KRAS G4 promoter region and pink box denotes non−G4-forming region. (B–D) Primers were utilized to amplify the G4 region (−23 to −491) and a non-G4 control region (+2,536 to +2,712) to examine the enrichment of G4, MAZ, and APE1 in the G4 region over the non-G4 control region by real-time ChIP-PCR. (B) Enrichment of G4 and MAZ in HCT116 control and constitutively expressing APE1 shRNA cells. (C) Enrichment of G4 and MAZ in HCT116 cells expressing Dox-inducible NTCshRNA and APE1shRNA. (Inset) APE1 levels in these cell extracts were examined by Western blot analysis with α-APE1 and α-HSC70 (loading control). (D) Enrichment of APE1, BG4, and MAZ in HCT116 control and APE1 shRNA cells treated with 50 ng/mL GO for 30 min. (E) Relative KRAS gene expression (normalized to GAPDH) in control (ctrl) and APE1 knockdown cells with or without GO treatment was measured by real-time PCR. (Inset) The APE1 level in these cell extracts was examined by Western blot analysis with α-APE1 and α-HSC70 (as loading control); mRNA, messenger RNA. (F) HCT116 cells expressing APE1shRNA were treated with Dox (2 µg/mL) for 2 days and then transfected with FLAG-tagged WT, or acetylation-defective K5R (Lysine 6, 7, 27, 31, and 32 to arginine), or repair-defective H309A APE1 plasmid constructs for 24 h. RT-PCR was performed to measure KRAS expression. The P value was calculated using unpaired Student’s t tests (****P < 0.0001, ***P < 0.001, **P < 0.01, *P < 0.05, n.s. (nonsignificant) = P > 0.05). Error bars denote +SD.

