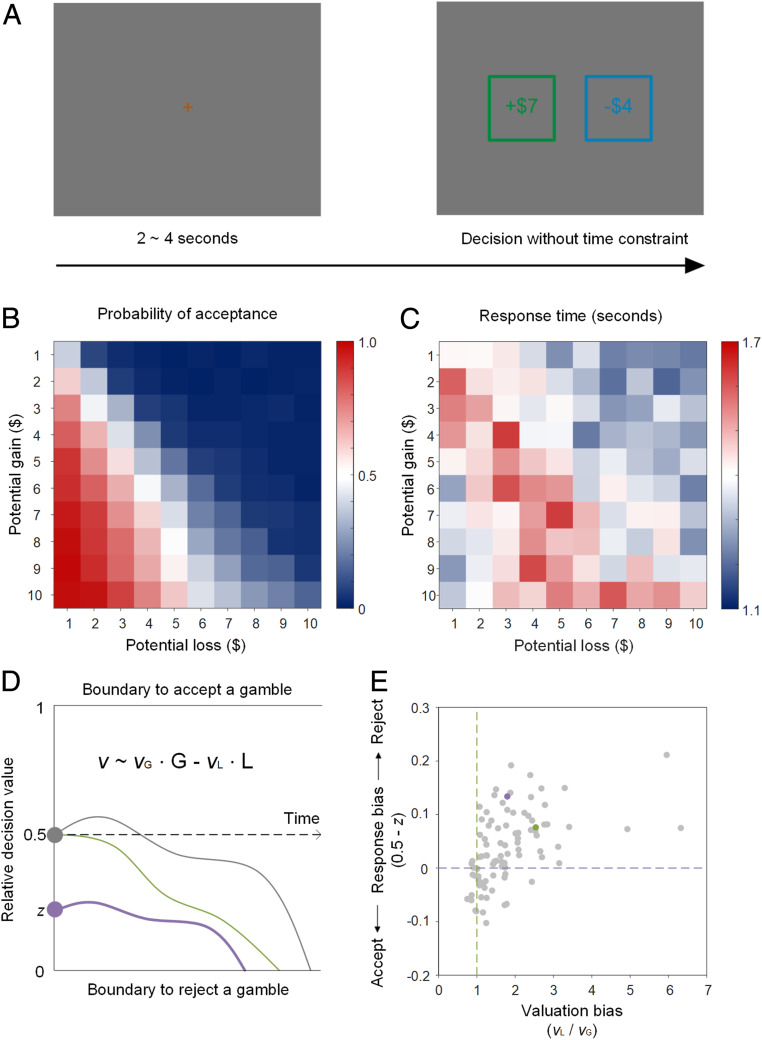
Fig. 1.
Behavior. (A, Top) Gambling task. Gambles were not resolved after decisions. (Middle) Probability of acceptance (B) and response times (C) across gambles. (Bottom) Illustration of the DDM for the gambling task (D) and estimates of valuation bias and response bias for each individual participant (E). Each dot represents a participant: those to the right of the green dashed line displayed valuation bias of overweighing loss relative to gains, and those above the purple dashed line displayed a response bias to reject gambles. The green dot (P69) and the purple dot (P46) in quadrant 1 indicate the two example participants illustrated in SI Appendix, Fig. S6 and SI Appendix, Fig. S7.

