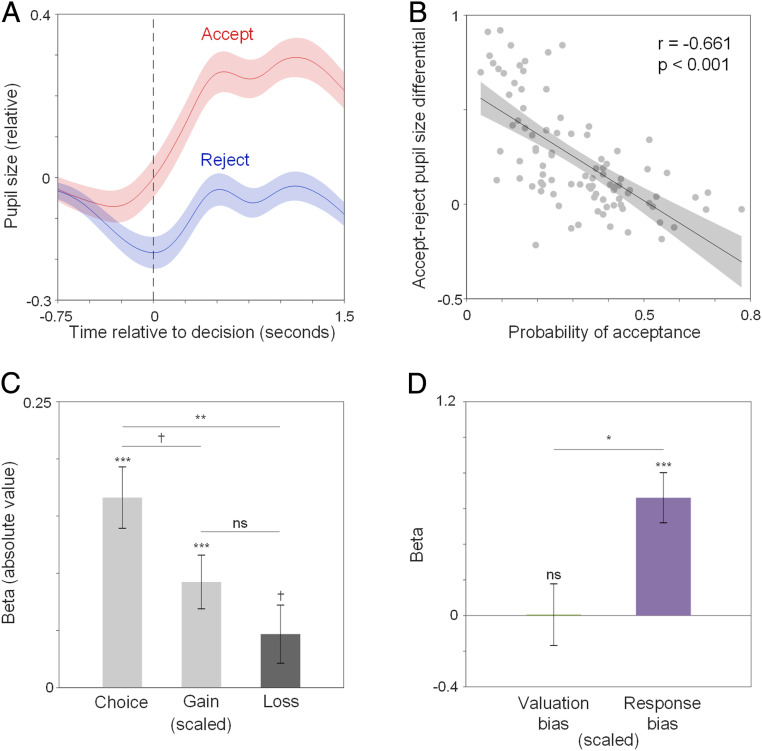
Fig. 3.
Pupil. (A) Change in pupil size around the time of the decision (t = 0) to accept (red) vs. reject (blue) gambles. (B) Correlation between probability of gamble acceptance and accept–reject pupil-size differential. (C) Influence of choice, gain, and loss on decision-related pupil size across trials. Black and gray bars denote negative and positive beta values, respectively. (D) Accept–-reject pupil-size differential predicted by valuation bias and response bias. Error bars indicate SEs. ***: P < 0.001; **: P < 0.01; *: P < 0.05; †: P < 0.1; ns: nonsignificant, P > 0.1.

