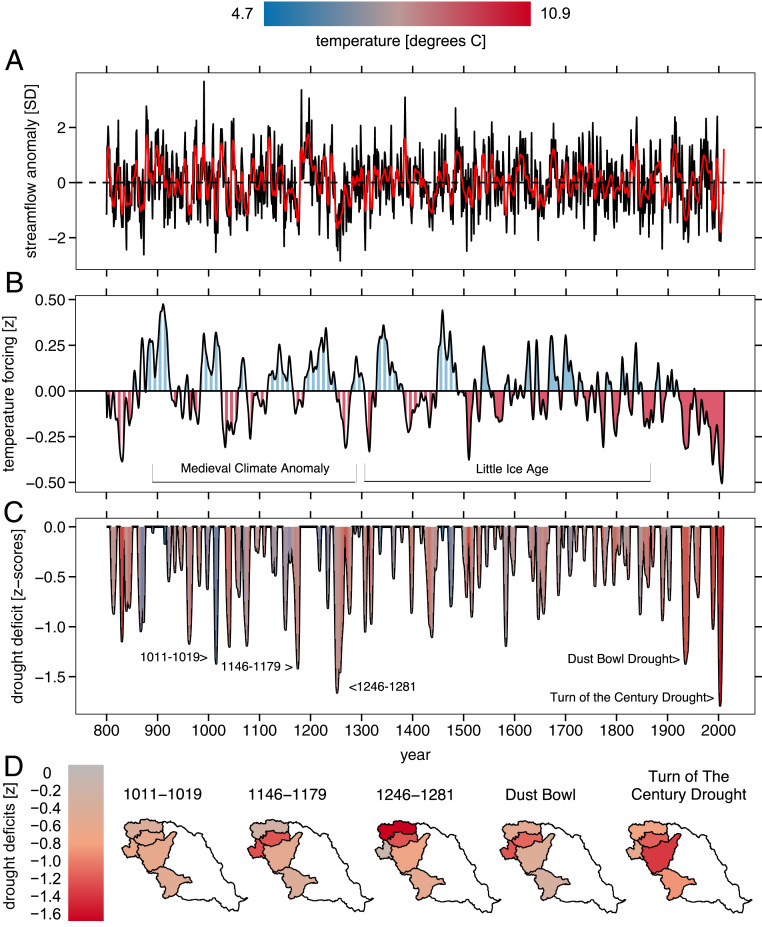
Fig. 2.
Streamflow, temperature forcing of streamflow, drought severity, and spatial distributions of the five most severe droughts in the UMRB over the last 1,200 y. The time series of reconstructed streamflow (A), the 10-y spline of temperature forcing of streamflow (B), and decadal-scale drought deficits (C) for the UMRB. The red line in A shows the 10-y cubic smoothing spline of streamflow and the dashed horizontal line shows the long-term mean. Color in B denotes positive (blue) and negative (red) forcings. White hatching in B denotes the period of high uncertainty in the UMRB regional temperature reconstruction. Color in C denotes temperature in the basin over the periods of the various drought events. D shows the spatial distributions of maximum flow deficits during the five major droughts annotated in C; 1930 to 2010 are instrumental data and 800 to 1929 are reconstructed.

