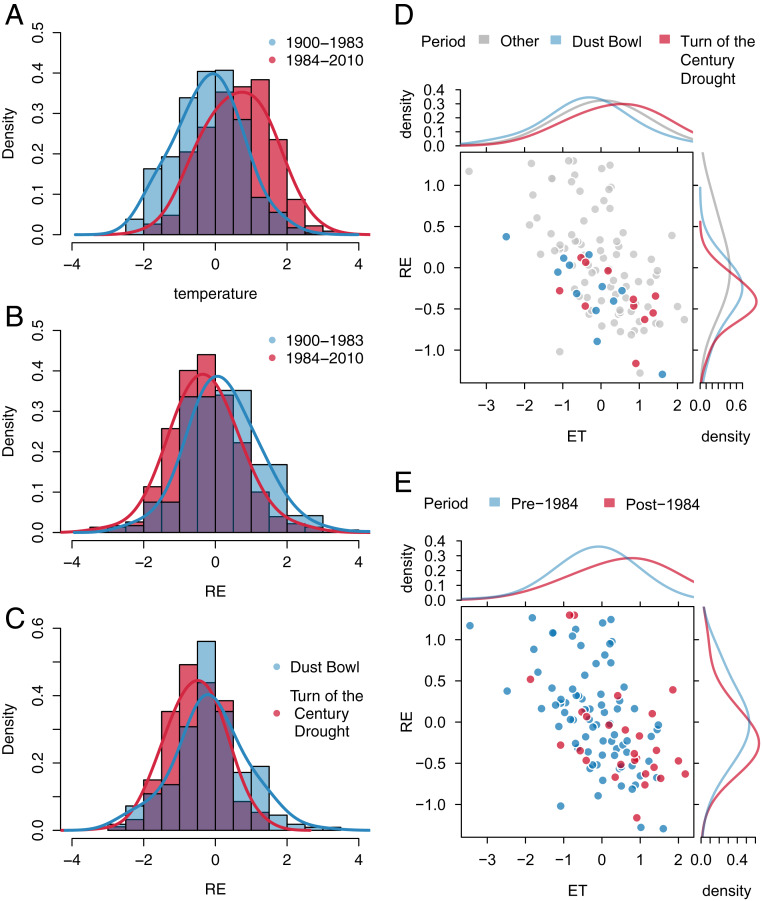
Fig. 5.
UMRB basin-wide temperature, ET, and RE. Distributions of (A) observed runoff-season (March through August) temperature and (B) RE from 1900 to 1983 (blue) and 1984 to 2010 (red), n = 1870. C shows the distributions of observed RE during the years of the Dust Bowl drought (blue) and turn-of-the-century drought (red), n = 408. Lines show the kernel density estimates of the distributions. D and E show the relationship between aggregated, basin-wide modeled ET and RE with color in D denoting values during the two major droughts of record in the UMRB and color in E denoting values from before and after 1984. Curves on the top and right axes show the kernel density estimates of the distributions of the values within each time period being compared. SI Appendix, Table S1 provides statistics for the time period comparisons based on the full, nonaggregated modeling results.

