Fig. 1.
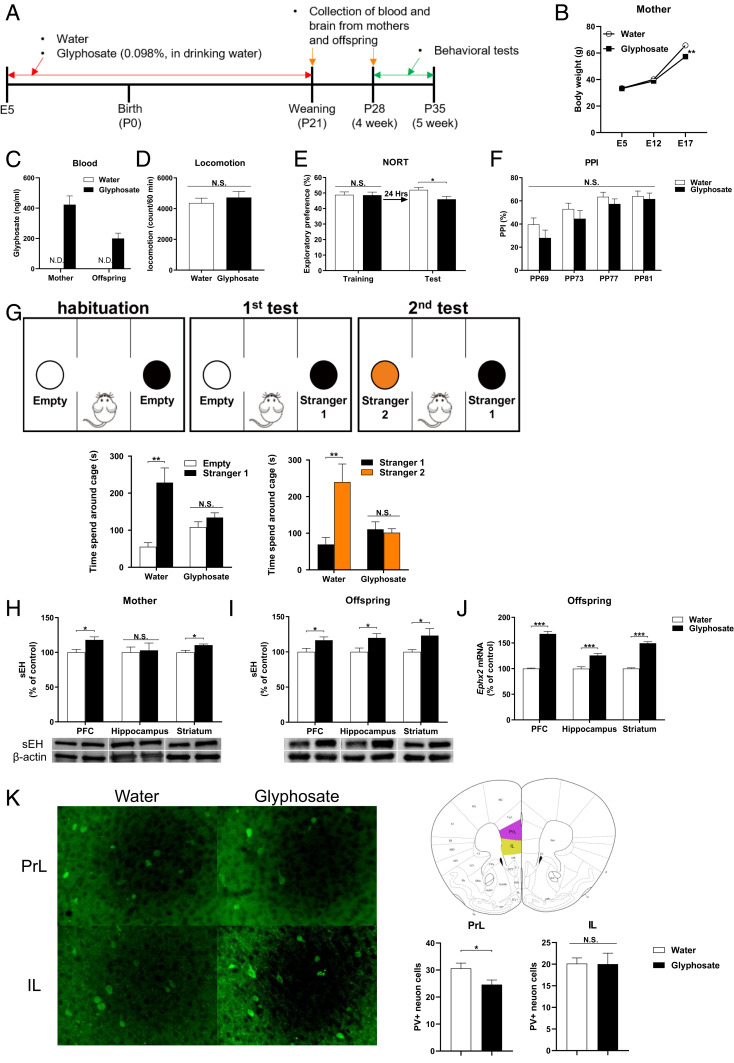
Social interaction deficits, increased expression of sEH, and decreased PV immunoreactivity in the brain from juvenile offspring after maternal glyphosate exposure. (A) Schedule of treatment, behavioral tests, and sample collection. (B) Change of body weight of pregnant mothers (n = 6). (C) Blood levels of glyphosate in the mothers and offspring at P21. Data are shown as mean ± SEM (mother n = 7, offspring n = 10). (D) Locomotion. Data are shown as mean ± SEM (n = 7 or 8). (E) Novel object recognition test (NORT). Data are shown as mean ± SEM (n = 8). (F) Prepulse inhibition (PPI) test. Data are shown as mean ± SEM (n = 8). (G) Three-chamber social interaction test. (Left) Two-way ANOVA (glyphosate, F1,22 = 4.747, P = 0.040; stranger, F1,22 = 141.2, P < 0.001; interaction, F1,22 = 76.77, P < 0.001). (Right) Two-way ANOVA (glyphosate, F1,22 = 9.760, P = 0.005; stranger, F1,22 = 26.75, P < 0.001; interaction, F1,22 = 33.38, P < 0.001). Data are shown as mean ± SEM (n = 6 or 7). (H) Protein expression of sEH in the PFC, hippocampus, and striatum of mothers. Data are shown as mean ± SEM (n = 4 or 5). (I) Protein expression of sEH in the PFC, hippocampus, and striatum from juvenile offspring (P28). Data are shown as mean ± SEM (n = 10). (J) Gene expression of Ephx2 mRNA in the mouse brain regions from juvenile offspring (P28). Data are shown as mean ± SEM (n = 8). (K) PV immunoreactivity in the prelimbic area (PrL) and infralimbic (IL) of mPFC. The values represent the mean ± SEM (n = 8; *P < 0.05, **P < 0.01, ***P < 0.001 compared to control group by Student t test). N.S., not significant.

