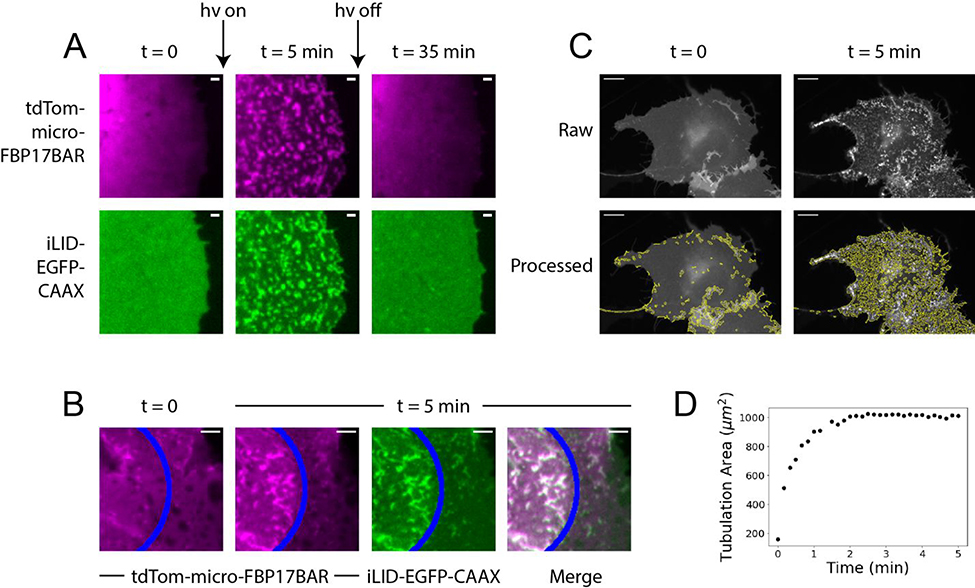
Figure 3:
Spatiotemporal controlled generation of positive membrane curvature by opto-FBAR. A) COS7 cells expressing the opto-FBAR system were exposed to blue light for 5 minutes, which induced significant membrane tubules. Light-induced positive membrane curvature is fully reversed after 30 min in the dark. Full field images available in Supplementary Figure S5. Scale bar = 1 μm. B) A subcellular region (areas to the left of the blue line) of COS7 cells expressing opto-FBAR system were exposed to blue light for 5 minutes. Membrane tubules are induced in the region exposed to blue light. Full field images available in Supplementary Figure S6. Scale bar = 5 μm. C) Green channel (iLID-EGFP-CAAX) were analyzed with TubuleTracer to quantify the tubulation extent over time. The results are shown under the raw images. Scale bar = 10 μm. D) The plot of tubulation area vs time from the cell shown in C. Tubulation reaches a maximum around 2 min.

