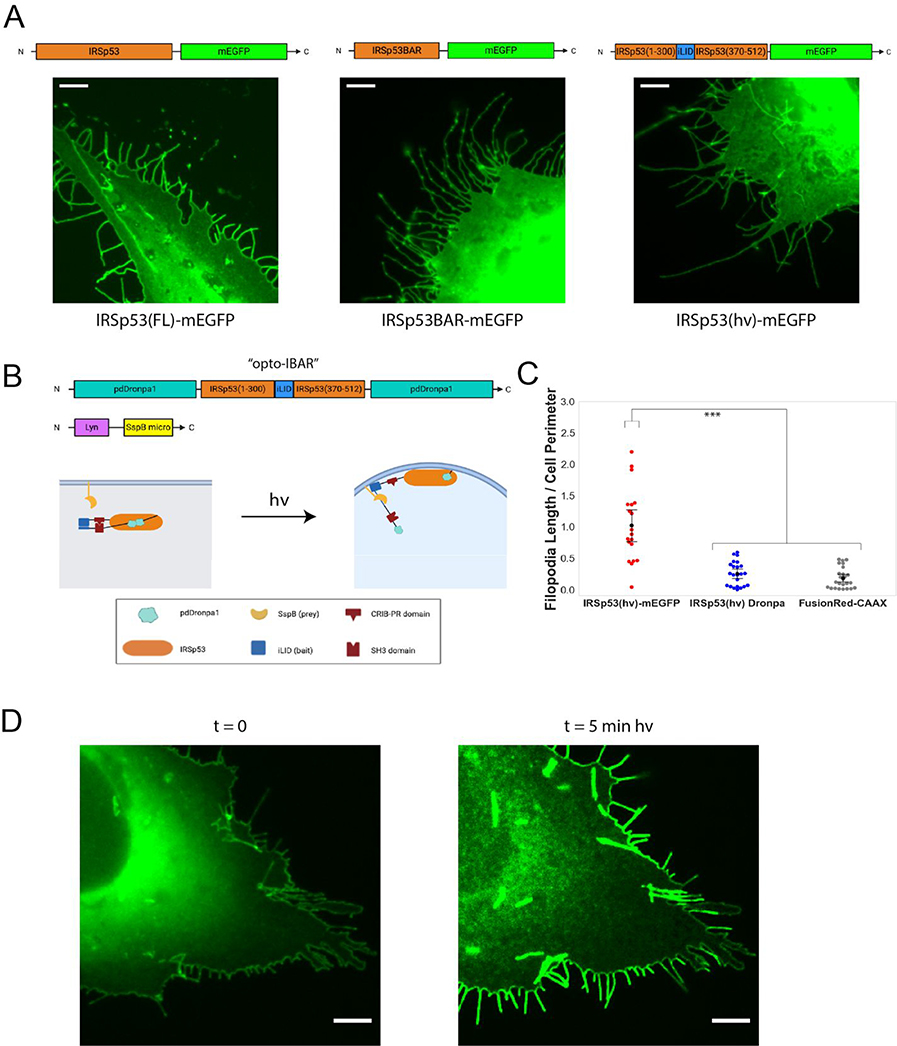
Figure 4:
The construction and optimization of opto-IBAR. A) U2OS cells overexpressing indicated IRSp53 constructs show substantial amounts of filopodial protrusions. Scale bars = 5 μm. Full field images available in Supplementary Figure S8. B) Schematic depicting IRSp53 photocaging by pdDronpa1 and the final opto-IBAR constructs. C) Swarm plots of total filopodia length normalized to cell perimeter. ***p < 0.005. D) Images of U2OS cell expressing opto-IBAR construct before (left) and after (right) 5 minutes of blue light activation show dramatic increase of the filopodia length. Scale bars = 5 μm. Note: Images were bleach corrected using the histogram matching method in ImageJ. Full field images available in Supplementary Figure S9.

