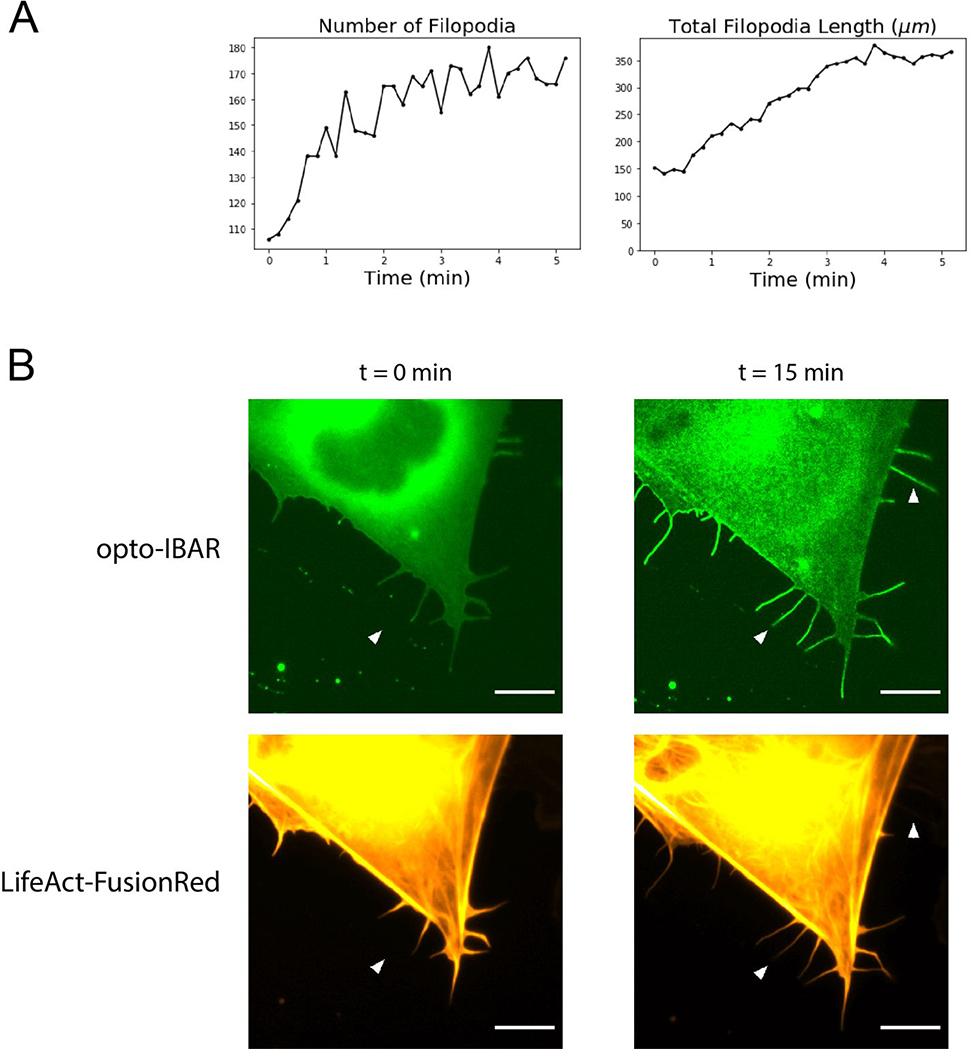
Figure 5:
A) Plots of filopodia number and total filopodia length from FiloQuant analysis of cell shown in Figure 4D. B) Zoomed images of U2OS cells expressing the opto-IBAR system and a LifeAct-FusionRed F-actin marker. Cells were activated with blue light for 15 minutes as described in Methods. Most filopodia contain F-actin, but some long filopodia are devoid of F-actin (arrows). Scale bars = 5 μm. Note: Green channel images were bleach corrected using the histogram matching method in ImageJ. Full field images available in Supplementary Figure S10.

