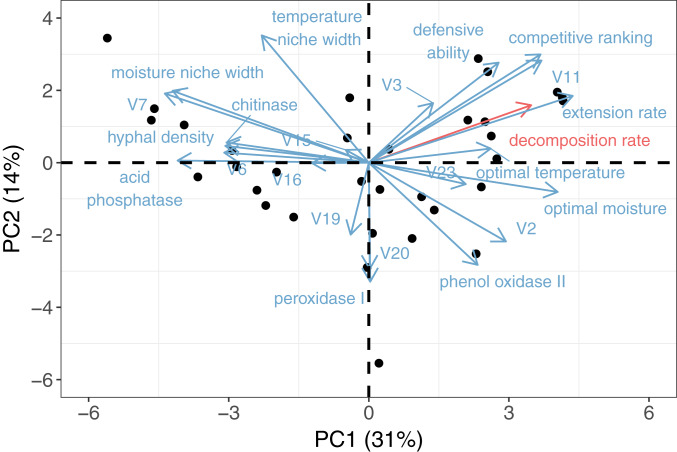
Fig. 3.
Principal component analysis of decomposition, growth and ecological performance traits, and enzyme production across 34 fungal isolates (full variable names for V2, V3, etc., listed in SI Appendix, Table S1). The PC1 axis (explaining 31% of variation) represents a dominance-tolerance trade-off across taxa, ranging from fast-growing, highly competitive isolates to stress-tolerant isolates with wide moisture niches and high enzyme production. Decomposition rate (red, PC1 loading = 0.25) strongly aligns with extension rate and combative ability along this trade-off axis. Results therefore closely match a previous principal component analysis of the trait dataset only (25), with small differences due to the added variable of decomposition rate.

