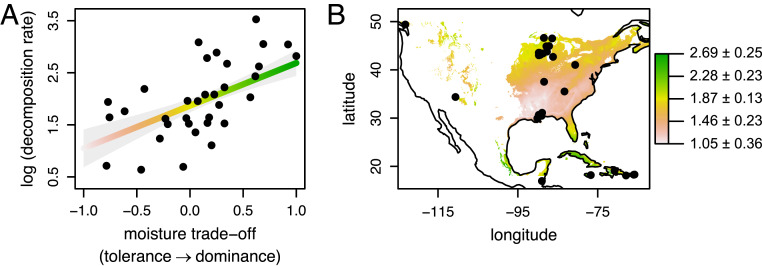
Fig. 4.
The relationship between decomposition rate (percentage mass loss over 122 d, log-transformed) and the dominance/moisture tolerance trade-off (A), projected across North America (B). The moisture trade-off (x axis in A) is the difference between each isolate’s competitive ranking and their moisture niche width, both scaled to [0,1], as calculated by Maynard et al. (25). Points in A represent fungal isolates, the line and shading indicate predictions ± SEM from a general linear model (overall slope excluding species indicator effects of Armillaria gallica and Merulius tremellosus). Color shading in both A and B indicates decomposition rate, increasing along the fitted line in A. Thus, the map in B represents predicted decomposition rates, as projected onto the previously published spatial distribution of the moisture trade-off (25). Points in B indicate sampling locations of fungal isolates (n = 34). The sampling location of one isolate (−146.69, 60.73) falls outside the spatial extent of the map.

