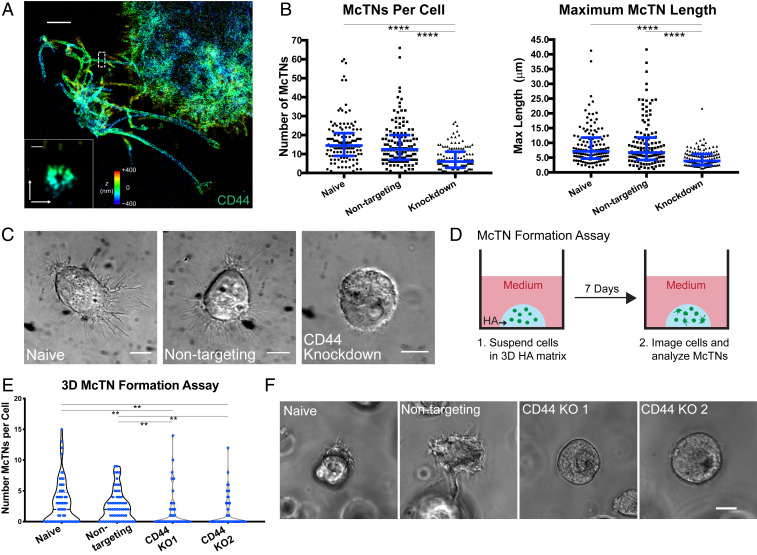
Fig. 2.
McTNs are CD44-dependent. (A) STORM imaging of CD44-covered McTNs at periphery of U-251 MG cell on HA matrix, with Inset showing transverse axis. Colors indicate z position. (Scale bar: A, 2 µm; Inset, 100 nm.) (B) shRNA KD of CD44 in U-251 MG cells on HA leads to a reduction of McTN number and length. n = 130 total cells from three independent experiments. ****P < 0.0001 by Kruskal–Wallis test followed by Dunn’s multiple comparisons test. Blue lines represent median with interquartile range. (C) DIC imaging of spread naive and nontargeting U-251 MG cells compared to rounded and poorly adhered shRNA CD44 KD cells. (Scale bars: 10 µm.) (D) Schematic of McTN formation assay in which cells are suspended in 3D HA, cultured for 7 d, and then imaged. (E) Number of McTNs formed per naive and nontargeting U-87 MG cells compared to CD44 KO controls. n = 60 total cells analyzed from three independent experiments. **P < 0.01 by Kruskal–Wallis test followed by Dunn’s multiple comparisons test. (F) Example phase images of cells from the high McTN expressing population in naive and nontargeting cells and the population expressing no McTNs in the CD44 KO cells. (Scale bar: 10 µm.)

