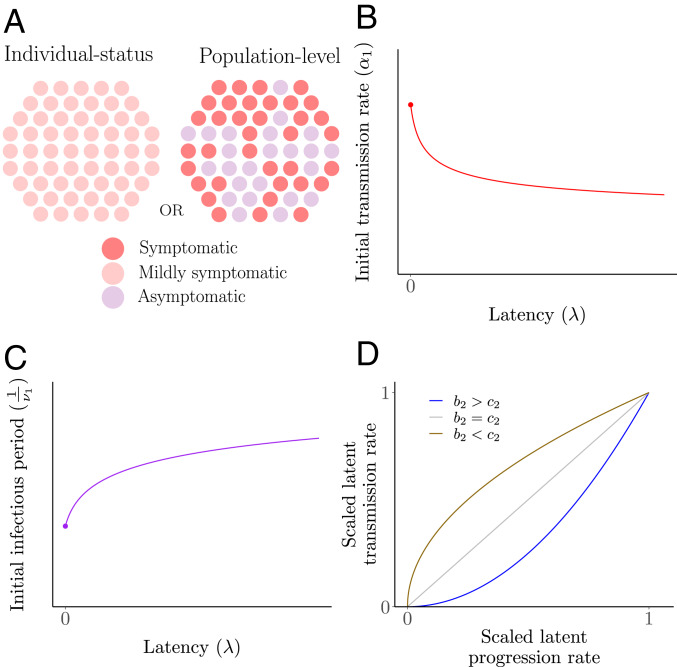
Fig. 2.
Schematics of trade-offs. The first stage of an infection may present as less symptomatic, leading to a longer first stage but at the cost of reduced transmission. (A) Interpretations of latency. Since our model formulation considers bilinear mass action incidence, latency can be viewed on individual-status or population-level bases. Each circle denotes a host in the first stage of an infection, and the shading corresponds to symptoms. The former implies mild symptoms for each host, whereas the latter implies a fraction of hosts in fully asymptomatic and the others fully symptomatic. As a function of latency , we model (B) the initial stage transmission rate and (C) the rate of progression from the first infectious stage to the second infectious stage in general terms as and , respectively, with . (D) Illustration of the possible shapes of the scaled initial transmission rate as a function of the scaled initial-stage progression rate, depending on values of and . Here, the scaled rates are simply and , respectively.

