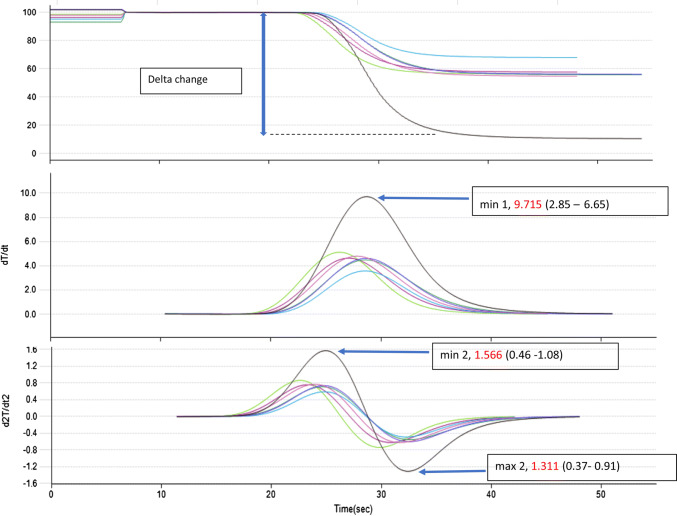
Fig. 3.
aPTT clot waveform analysis showing markedly raised min1 of 9.715%/s, min2 of 1.566%/s, max2 of 1.311%/s and delta change of 0.9644, suggestive of a hypercoagulable state (patient’s clot waveform curve in black in comparison with 5 normal healthy individuals multicolour clot waveform curves). Reference ranges for min 1 (2.85–6.65%/s), min 2 (0.46–1.08%/s), max 2 (0.37–0.91%/s), delta change (0.10–0.41) were established at our centre based on 105 healthy individuals in accordance with the Clinical and Laboratory Standards Institute guidelines

