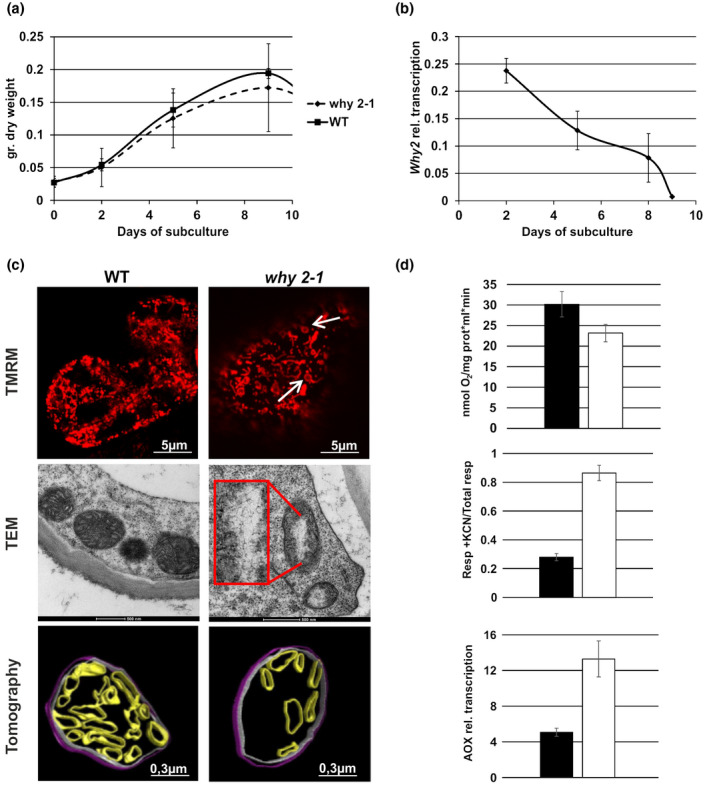
FIGURE 1.

WT and why 2‐1 Arabidopsis suspension cell cultures. (a) Growth curve calculated as dry weight (gr.) at different days after subcultures. (b) Why 2 expression profile in WT suspension cell cultures at different days after subcultures. (c) Confocal, transmission electron microscope images and tomographic 3D reconstruction model of mitochondria from suspension cell cultures at 5 days after subcultures. Inset magnification 3X. Arrows in the CLSM image indicate mitochondria with peculiar morphology. Different colors were used for the rendering of the different suborganellar structures in the tomographic 3D reconstruction: magenta for inner membranes (IM), blue for outer membranes (OM), and green for cristae. (d) Mitochondria functionality in WT and why 2‐1 suspension cell cultures defined as: Oxygen consumption (upper plot), alternative oxidase capacity (middle plot) of cells treated with 1 mM KCN, relative expression profile of the alternative oxidase (AOX; lower panel). Values represent the mean ± standard deviation of three independent experiments performed in triplicate. The asterisks indicate values that are significantly different from WT cells using the Student's t test method (*p < .05)
