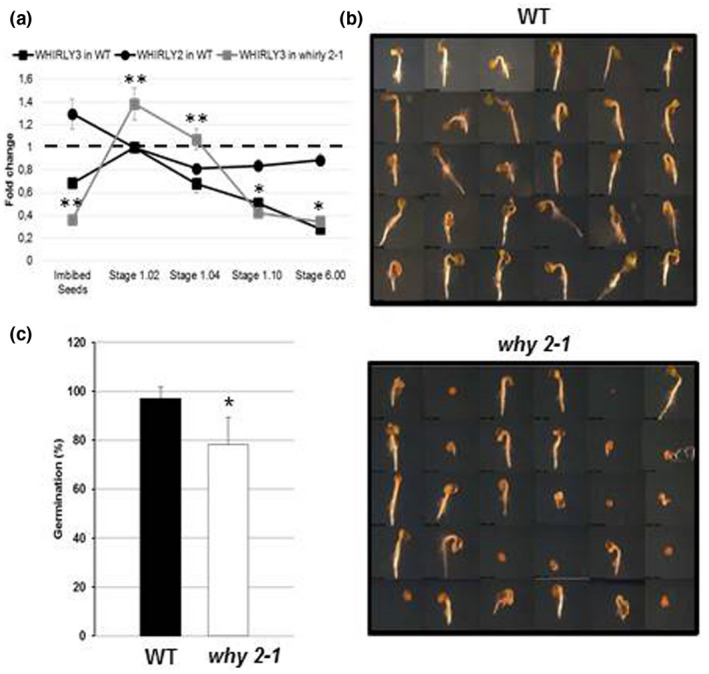
FIGURE 4.

Germination assay of WT and why 2‐1 mutant. (a) Expression profile of Why 2 and Why 3 genes in WT and why 2‐1 plants and seeds. The expression was analyzed in 24 hr imbibed seeds and in plants at 1.02, 1.04, 1.10, and 6.00 stages of growth. Data were analyzed using the ΔΔCT method. Values represent the mean ± confidence interval (p < .05) of three independent experiments performed in triplicate. (b) Representative stereomicroscope images of WT and why 2‐1 seedlings 4 days after sowing (DAS); (c) Percentage of germinated seed at 4 DAS
