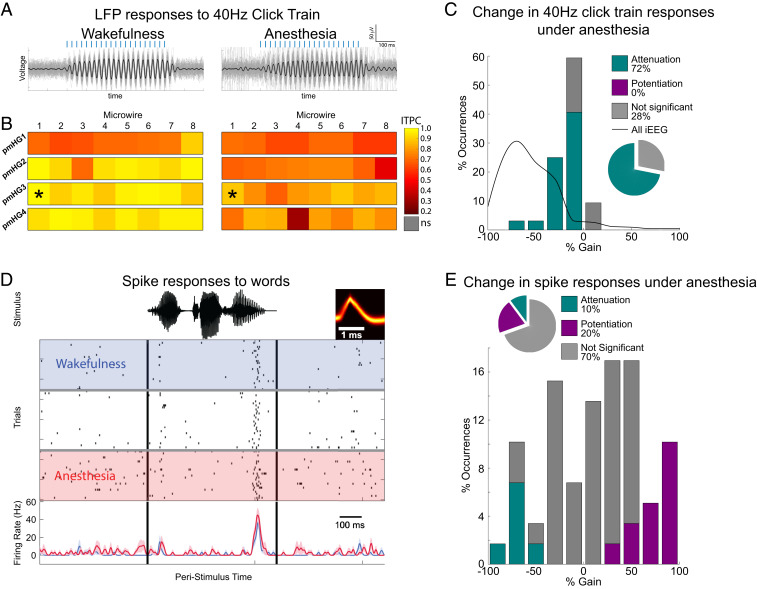
Fig. 3.
Significant responses in primary auditory cortex persist upon anesthesia-induced LOC. (A) Band-passed responses to 40-Hz click train in a representative PAC electrode during wakefulness (Left) and anesthesia (Right). Thick black traces mark the average responses, while thin gray traces show individual trials. (B) Responses (ITPC) to 40-Hz click trains across all PAC microwires (n = 32, arrays pmHG 1–4) during wakefulness (Left) and anesthesia (Right) reveals significant responses persisting upon anesthesia-induced LOC. Asterisks mark the specific microwire whose responses are shown above. (C) Histogram of response gain under anesthesia for all 32 PAC microwires shows only minimal attenuation (bars), especially when compared to the marked attenuation seen across the brain in iEEG contacts (gray curve). (D) Raster plot and peristimulus time histogram (PSTH, below) of representative PAC neuronal response to a word (stimulus waveform on top in black; neuron spike waveform in yellow). Rows (top to bottom) mark individual trials during deepening propofol anesthesia. Blue shading and time course, wakefulness; red shading and time-course, anesthesia. (E) Quantitative analysis across all PAC responses (n = 59 in 20 neurons) reveals that 70% of responses were not significantly different between wakefulness and anesthesia, 10% were attenuated in anesthesia, and 20% were potentiated in anesthesia.

