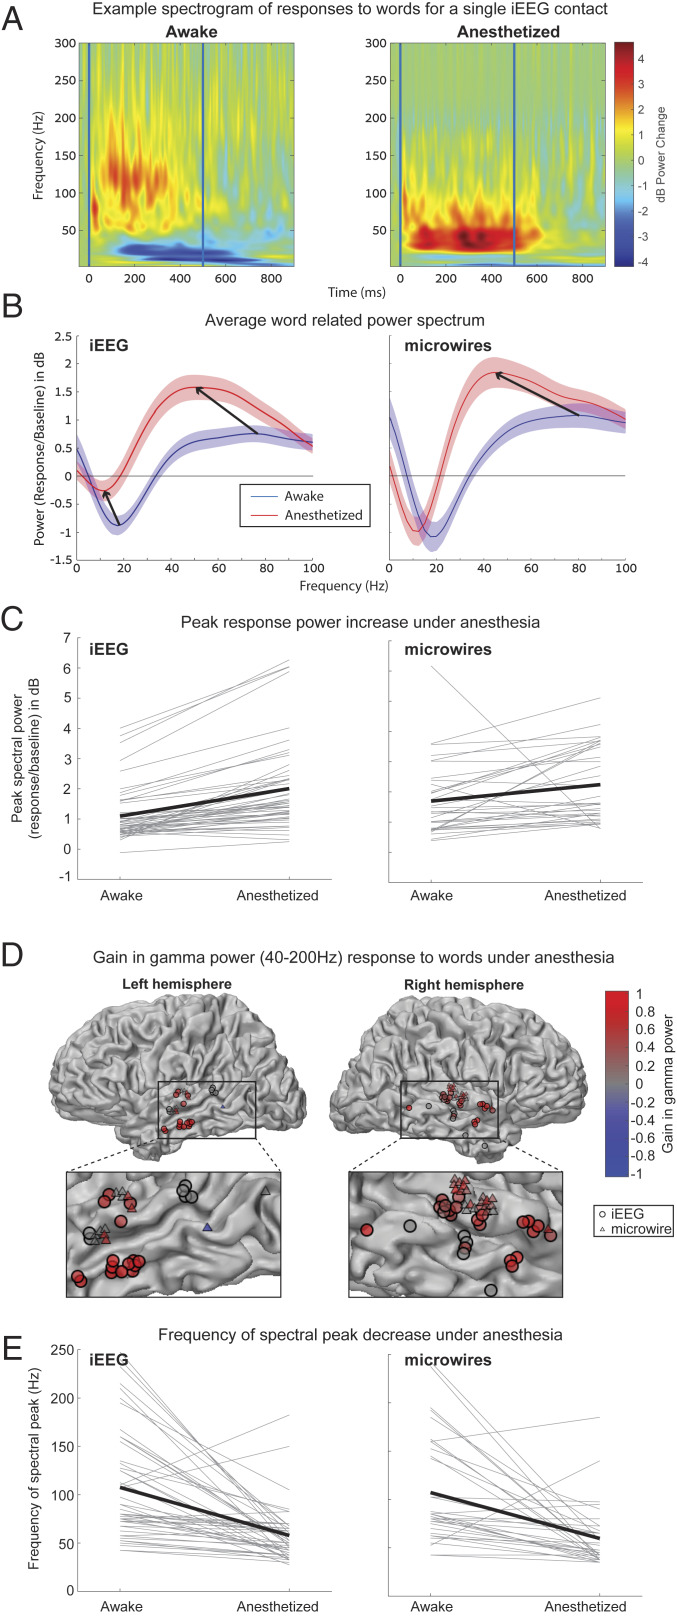
Fig. 5.
Induced gamma power responses to words upon anesthetic LOC. (A) Example of a single temporal lobe iEEG contact ERSP averaged across words, demonstrating an increase in peak power, a reduction in the frequency of the power peak, and reduction in alpha/beta desynchronization, under anesthesia. (B) The power spectrum averaged over all 50 significantly responding (P < 0.005) iEEG contacts (Left) and all 34 significantly responding microwires (Right) shows the same increase in peak power and shift to lower frequencies of the power peak. The iEEG spectrum also shows the reduction in alpha/beta desynchronization noted above. The peak power (C) and frequency of the power peak (E) plotted for each individual responding iEEG contact/microwire shows that these changes are consistent across contacts. (D) Plot of all 50 responding iEEG contacts and 34 responding microwires colored according to gain in gamma power under anesthesia. Responses are clustered exclusively around the temporal lobe and in 83/84 cases show increased power or no change.

