Fig. 1.
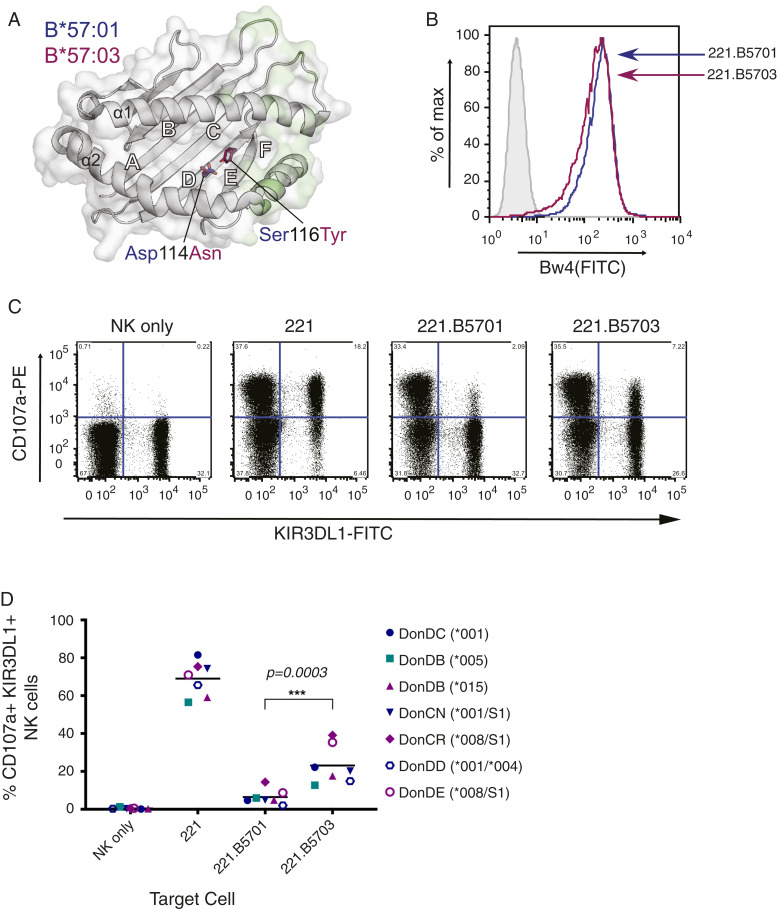
Greater inhibition of KIR3DL1+ NK cells by HLA-B*57:01 than HLA-B*57:03. (A) Location of the two HLA-B57 polymorphisms (Asp114Asn and Ser116Tyr) which distinguish HLA-B*57:01 and HLA-B*57:03. The HLA binding groove is represented as a gray schematic, and the surface with KIR3DL1 contact regions is highlighted in light green. Polymorphic residues, represented as sticks with carbon atoms colored by allele (HLA-B*57:01, blue; HLA-B*57:03, magenta) and by atom (O, red; N, blue), are buried in the D and E pockets away from KIR3DL1 contact. Generated using PDB accession codes 3VH8 (12) and 5VWF (2). (B) Surface expression of transfected HLA-B*57:01 and HLA-B*57:03 molecules on 221 cells, as detected with anti-Bw4 supernatant followed by anti-mouse Ig-FITC. Shaded and light gray histograms represent unstained and 221 cells stained with anti-Bw4, respectively. Blue lines correspond to 221.B5701, and magenta lines to 221.B5703. (C) NK cells were purified from healthy donor PBMCs and expanded with IL-2 before being incubated with 221 and transfected 221 targets. Following incubation with monensin and anti–CD107a-PE, degranulation was assessed by flow cytometry, staining for CD56 and NKB1 (anti-KIR3DL1). Representative plots depict the percentage of KIR3DL1+ and KIR3DL1− NK cells (gated on CD56+ cells) expressing CD107a with given targets (donor CN: KIR3DL1*001/S1). (D) Percentage expression of CD107a on CD56+, KIR3DL1+ NK cells following incubation with 221 targets from six donors (where KIR3DL1 high and low-expressing cells from donor DB were sorted and assessed separately) across two independent experiments (open versus closed symbols), and analyzed by a one-way ANOVA using a Tukey’s multiple comparison test (***P = 0.0003). Horizontal lines represent the mean. Teal, KIR3DL1*005; blue, KIR3DL1*001; purple, KIR3DL1*008/*015 (note that KIR3DL1*004 is a null allele that is not expressed at the cell surface).

