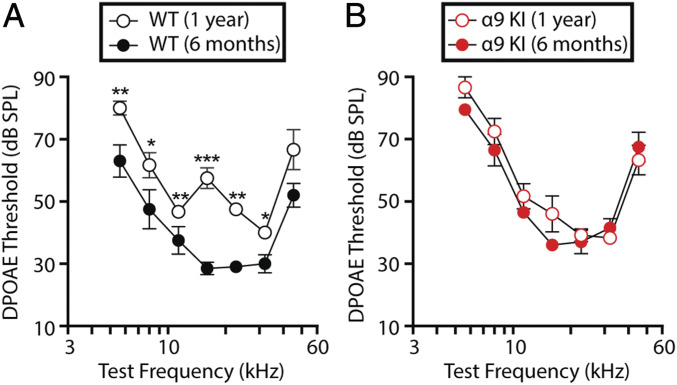
Fig. 2.
Evaluation of OHC functional integrity in young and aged WT and α9KI mice. (A) DPOAE thresholds for WT mice at 6 mo (n = 10) and 1 y of age (n = 6). (B) DPOAE thresholds for α9KI mice at 6 mo (n = 10) and 1 y of age (n = 6). DPOAE thresholds showed a significant increase at 1 y of age in WT but not in α9KI mice. Group means ± SEM are shown. Asterisks represent the statistical significance (Friedman test *P < 0.05, **P < 0.01, and ***P < 0.001).

