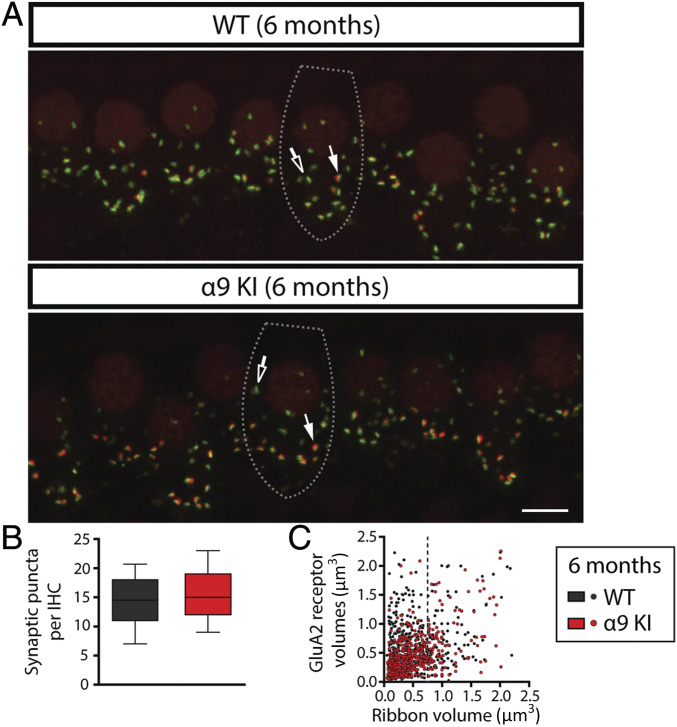
Fig. 4.
Analysis of IHC ribbon synapses in young WT and α9KI mice. (A) Representative confocal images of IHC synapses from the middle region of cochleae immunolabeled for presynaptic ribbons (CtBP2-red) and postsynaptic receptor patches (GluA2-green) from WT (Top) and α9KI (Bottom) mice at 6 mo of age. (Scale bar: 10 μm.) The dashed lines show the approximate outline of one IHC. Afferent synapses in IHC show opposite gradients in the size of the presynaptic and postsynaptic elements: synapses with large ribbons and small AMPAR patches (filled arrows) and those with large AMPAR patches and small ribbons (open arrows). CtBP2 antibody also weakly stains IHC nuclei. (B) Quantitative data obtained from young WT and α9KI mice at the midbasal cochlear turn. For each IHC, the number of putative ribbon synapses was analyzed: i.e., colocalized CtBP2 and GluA2 puncta (WT = 185 IHCs from 10 animals; α9KI = 306 IHCs from 10 animals). Horizontal lines inside the box plots represent the median, and whiskers correspond to percentiles 10 to 90. Comparisons were made by a Mann–Whitney U test. (C) Scatter plots comparing the volumes of fluorescence staining for ribbons (CtBP2 volume, x axis) and receptors (GluA2 volume, y axis) for each of the synaptic pairs from young WT (517 synaptic pairs from five animals, slope = 0.41 ± 0.03) and α9KI tissues (508 synaptic pairs from five animals, slope = 0.49 ± 0.05) spanning the whole region of the cochlea. Comparisons were made by F test.

