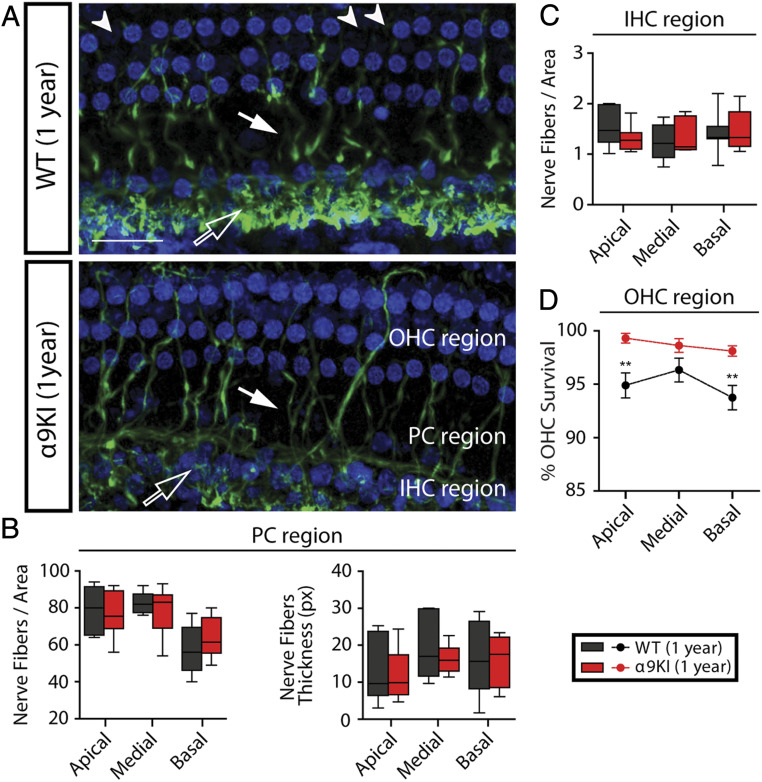
Fig. 6.
OHCs and nerve fibers’ quantification in aged WT and α9KI mice. (A) Representative confocal images of whole mounts organ of Corti immunolabeled for antineurofilament (green) and the nuclear dye Draq5 (blue) from WT (n = 10) and α9KI (n = 10) mice at 1 y of age (scale bar: 30 μm). Unfilled arrows indicate the thin fibers spiraling under the IHCs. MOC fibers projecting to OHCs and type II afferent neurons are indicated by filled arrows. Arrowheads point to lost OHCs. (B) Quantification of nerve fiber density and thickness at the PC region: nerve fiber density (Left) and thickness (Right) at the apical, medial, and basal portions of the cochlea. px, pixels. (C) Quantification of nerve fiber density at the IHCs’ region in basal, medial, and apical portions of the cochlea. Horizontal lines inside the box plots (B and C) represent the median, and whiskers correspond to percentiles 10 to 90. (D) Mean OHC survival ± SEM is plotted as a function of cochlear location from WT and α9KI mice at 1 y of age. In aged WT, there was some loss of OHCs compared to α9KI ears that was significant at the apical and basal cochlear region. Asterisks represent the statistical significance (Mann–Whitney U test, **P < 0.01).

